Solutions and questions
Overview
Teaching: 40 min
Exercises: 0 minQuestions
How do uncorrected and corrected jet momenta compare?
How large is the JEC uncertainty in different regions?
How large is the JER uncertainty in different regions?
Objectives
Explore the JEC and JER uncertainties using histograms
Practice basic plotting with ROOT
Open myoutput.root and investigate the range of momentum variation given by the JEC uncertainties by plotting:
- Corrected versus uncorrected jet momentum
- Corrected jet momentum with JEC up and down uncertainties
- Corrected jet momentum with JER up and down uncertainties
Questions:
Is the difference between the raw and corrected momentum larger or smaller than the uncertainty? Which uncertainty dominates?
Solution
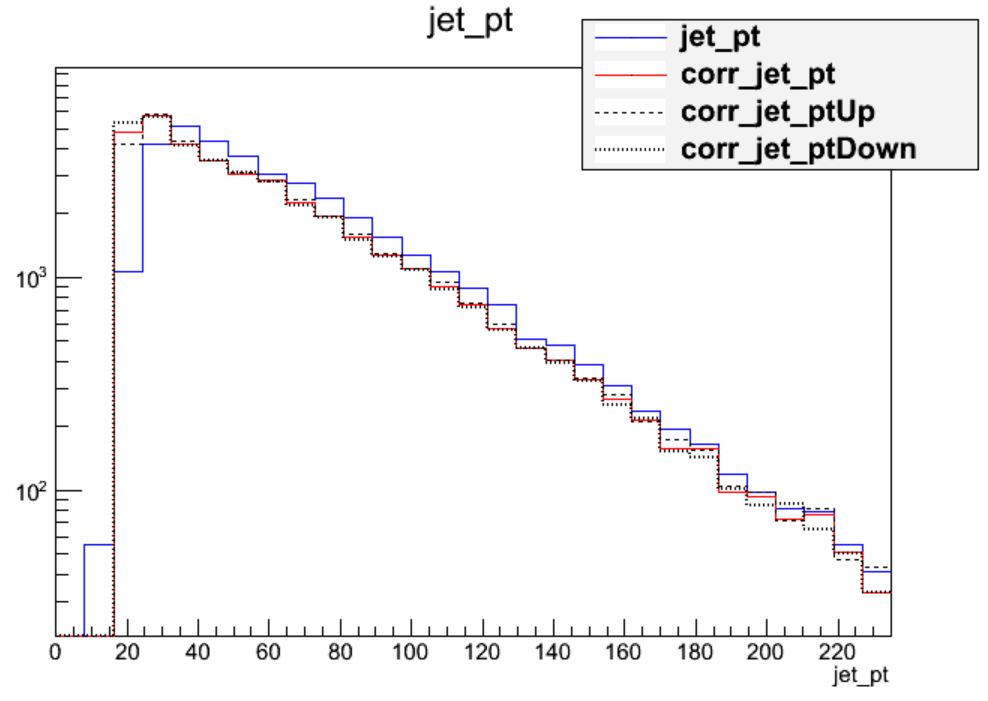
The following plotting commands can be used to draw the four histograms needed to answer the first question:
$ root -l myoutput.root
[1] _file0->cd("myjets");
[2] Events->Draw("jet_pt");
[3] Events->Draw("corr_jet_pt","","hist same");
[4] Events->Draw("corr_jet_ptUp","","hist same");
[5] Events->Draw("corr_jet_ptDown","","hist same");
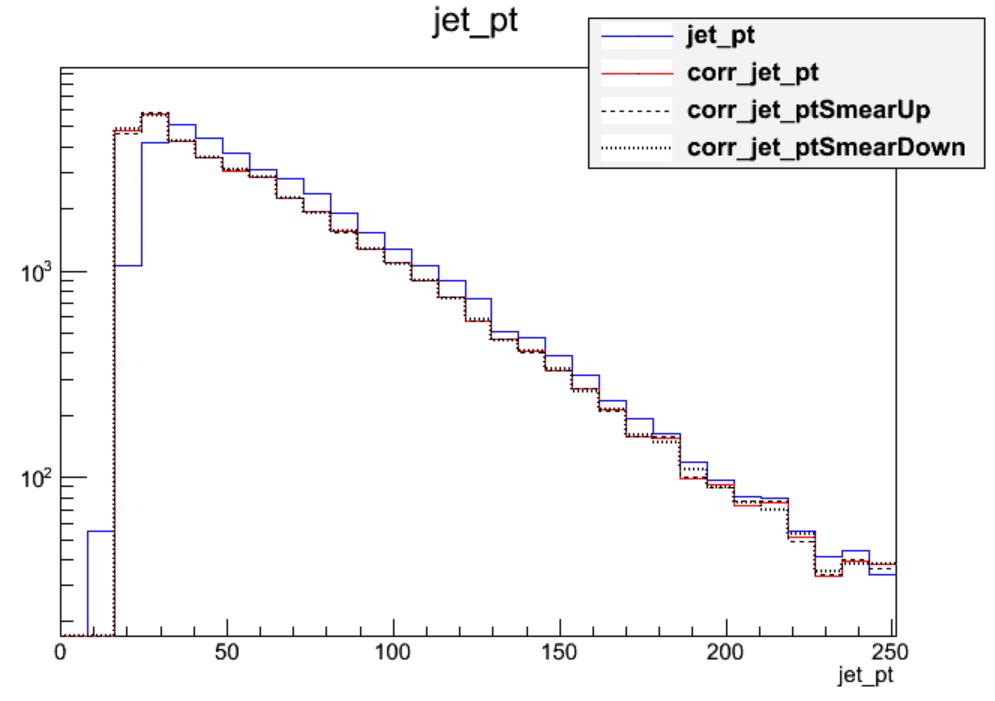
We can see that the corrections are significant, far larger than the uncertainty itself. The first level of correction, for pileup removal, tends to reduce the momentum of the jet. The JER uncertainty can be drawn using similar commands:
This uncertainty is much smaller for the majority of jets! The JER correction is similar to the muon Rochester corrections in that it is most important for analyses requiring higher precision in jet agreement between data and simulation.
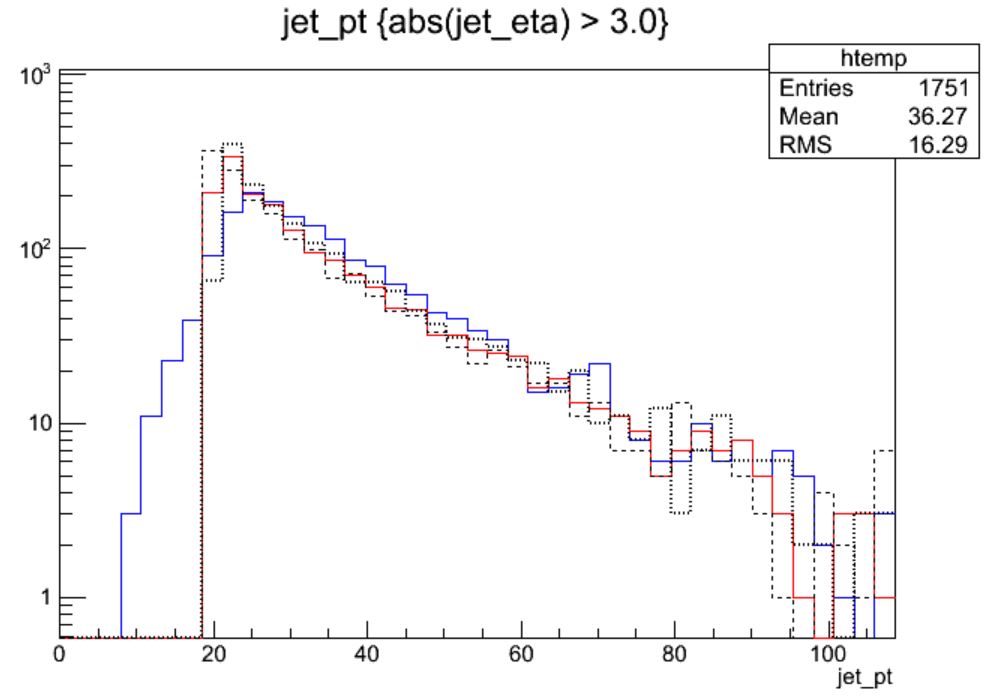
Repeat these plots with the additional requirement that the jets be “forward” (
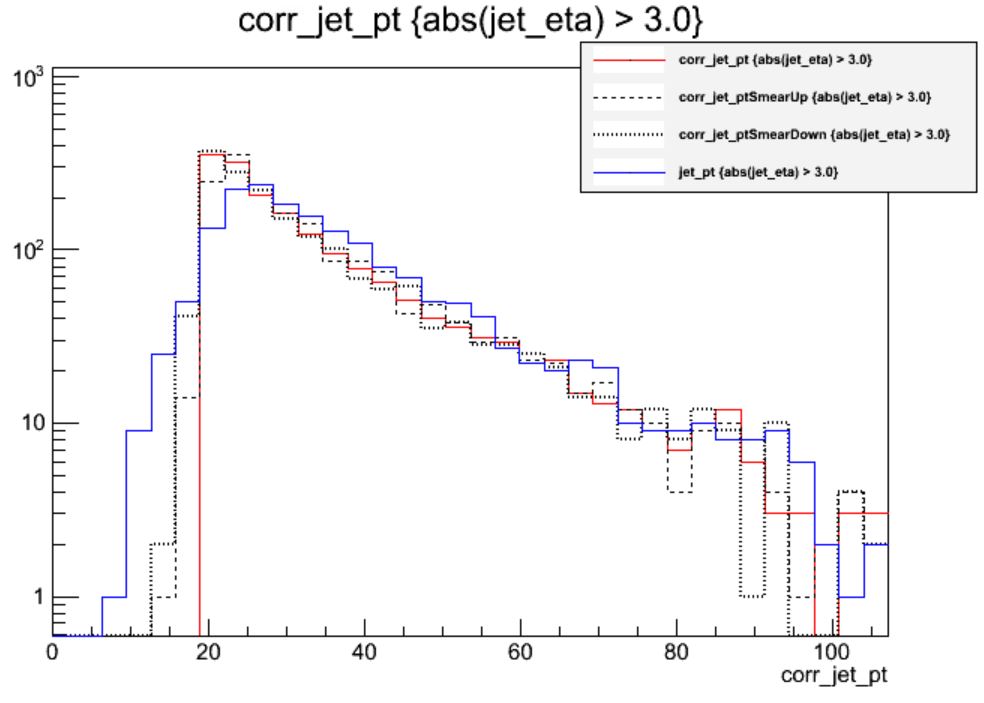
abs(jet_eta) > 3.0) How do the magnitudes of the uncertainties compare in this region?Solution
This time we need to apply cuts to the jets as we draw:
$ root -l myoutput.root
[1] _file0->cd("myjets");
[2] Events->Draw("jet_pt","abs(jet_eta) > 3.0");
[3] Events->Draw("corr_jet_pt","abs(jet_eta) > 3.0","hist same");
[4] Events->Draw("corr_jet_ptUp","abs(jet_eta) > 3.0","hist same");
[5] Events->Draw("corr_jet_ptDown","abs(jet_eta) > 3.0","hist same");

In the endcap region the uncertainty on the JER scale factor has become nearly 20%! So this uncertainty gains almost equal footing with JEC. Many CMS analyses restrict themselves to studying jets in the “central” region of the detector, defined loosely by the tracker acceptance region of
abs(eta) < 2.4precisely to avoid these larger JEC and JER uncertainties.
Key Points
In general, the jet corrections are significant and lower the momenta of the jets with standard LHC pileup conditions.
For most jets, the JEC uncertainty dominates over the JER uncertainty.
In the endcap region of the detector, the JER uncertainty in larger and matches the JEC uncertainty.


