Offline: Advanced object challenge
Overview
Teaching: 0 min
Exercises: 30 minQuestions
How do uncorrected and corrected jet momenta compare?
How large is the JEC uncertainty in different regions?
How large is the JER uncertainty in different regions?
Objectives
Explore the JEC and JER uncertainties using histograms
Practice basic plotting with ROOT
Let’s dig into the JEC and JER corrections and uncertainties by studying their effect on jet momentum histograms.
Run POET
Take some time to run POET using the entire top quark pair test file. In
python/poet_cfg.pyset the number of events to process to -1:#---- Select the maximum number of events to process (if -1, run over all events) process.maxEvents = cms.untracked.PSet( input = cms.untracked.int32(-1) )And run POET using
cmsRun python/poet_cfg.py False True. Great time to read ahead on tomorrow’s lessons!
Open myoutput.root and investigate the range of momentum variation given by the JEC uncertainties by plotting:
- Corrected versus uncorrected jet momentum
- Corrected jet momentum with JEC up and down uncertainties
- Corrected jet momentum with JER up and down uncertainties
Questions:
Is the difference between the raw and corrected momentum larger or smaller than the uncertainty? Which uncertainty dominates?
Repeat these plots with the additional requirement that the jets be “forward” (
abs(jet_eta) > 3.0) How do the magnitudes of the uncertainties compare in this region?
Recall: to draw plots on the ROOT command line use the following syntax:
$ root -l myoutput.root
[0] _file0->cd("myjets");
[1] Events->Draw("jet_pt"); // draw the branch jet_pt
[2] Events->Draw("jet_pt","abs(jet_eta) > 3.0","same"); // draw jet_pt with a cut on jet_eta, on top of the previous plot
[3] Events->Draw("jet_pt","abs(jet_eta) < 3.0","pe same"); // draw jet_pt again with a different cut using points & error bars
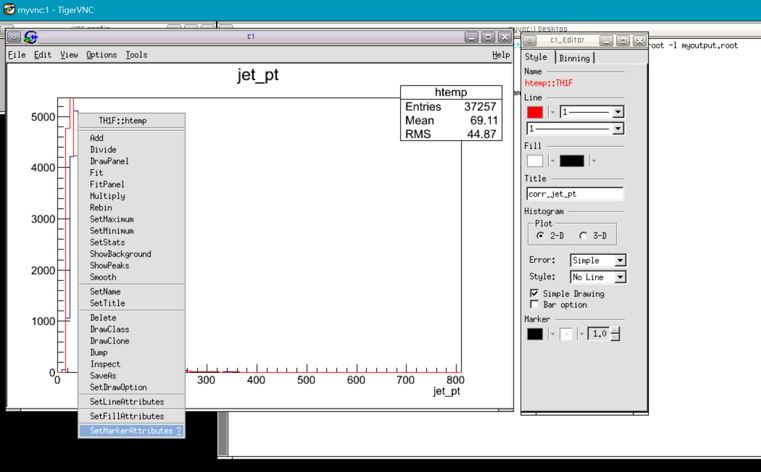
To use different line colors and styles in a plot, “right-click” on a histograms and use the “Set Line Attributes” GUI to change the color and style of the lines and markers. Clicking on a different histogram will automatically change which plot’s style the GUI is controlling.
Solutions
Come back tomorrow to go over these plots!
Key Points
Come back for the solutions session tomorrow!
