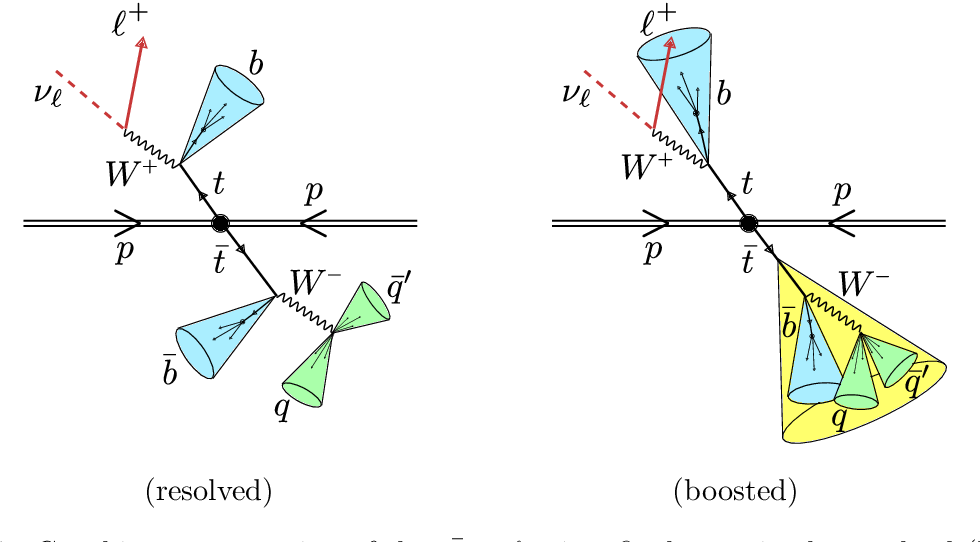
Image 1 of 1: ‘Two diagrams showing a top quark and antitop quark being produced where one decays through a leptonic process and the other decays through a hadronic process. The first image shows the hadronic decay in a non-boosted state and the second image shows the hadronic jets overlapping because of the boosted nature of the decay.’
Representation of the resolved (left) and
boosted (right) regimes of a top-quark pair decay. From the thesis
of M. Missiroli “Searches for top-antitop quark resonances in
semileptonic final states with the CMS detector”