Prep-work: Kubernetes Clusters
Overview
Teaching: 0 min
Exercises: 0 minQuestions
What is Kubernetes?
What is a Kubernetes cluster and why do I need one?
Objectives
Learn the very basics of Kubernetes
Learn a bit about the architecture of a Kubernetes cluster
Introduction
Most of you have been working with Docker containers throughout this workshop. As you know now, one could see these Docker containers like isolated machines that can run on a host machine in a very efficient way. Your desktop or laptop could actually run several of these containers if enough resources are available. For instance, you could think that one can maximize the hardware resources by running multiple CMSSW open data containers in one desktop. Imagine, if you could run 10 CMSSW containers (each over a single root file) at the same time in a single physical machine, then it will take you 10 times less time to skim a full dataset.
Now, if you had more machines available, let’s say 3 or 4, and in each one of them you could run 10 containers, that will certainly speed up the data processing (specially the first stage in our analysis flow example, which we will see later) Now, if you could have access to many more machines, then a few problems may appear. For instance, how would you install the software required in all those machines? Would there be enough personpower to take care of that? How would you take care of, and babysit all those containers?
The answer to most of these questions is Kubernetes, and, particularly, Kubernetes running on commercial clusters. Kubernetes (K8s) software is said to be an orchestrator of containers. Not necessarily Docker containers, but any brand which shares the same basic technological principles.
In this lesson you will learn about using commercial cloud computing resources in order to process CMS open data. Basically, we will introduce you to the arts of using a few machines (a cluster of computers) to run your containerized open data analysis workflows and manage them with tools that interact with the Kubernetes software.
K8s architecture
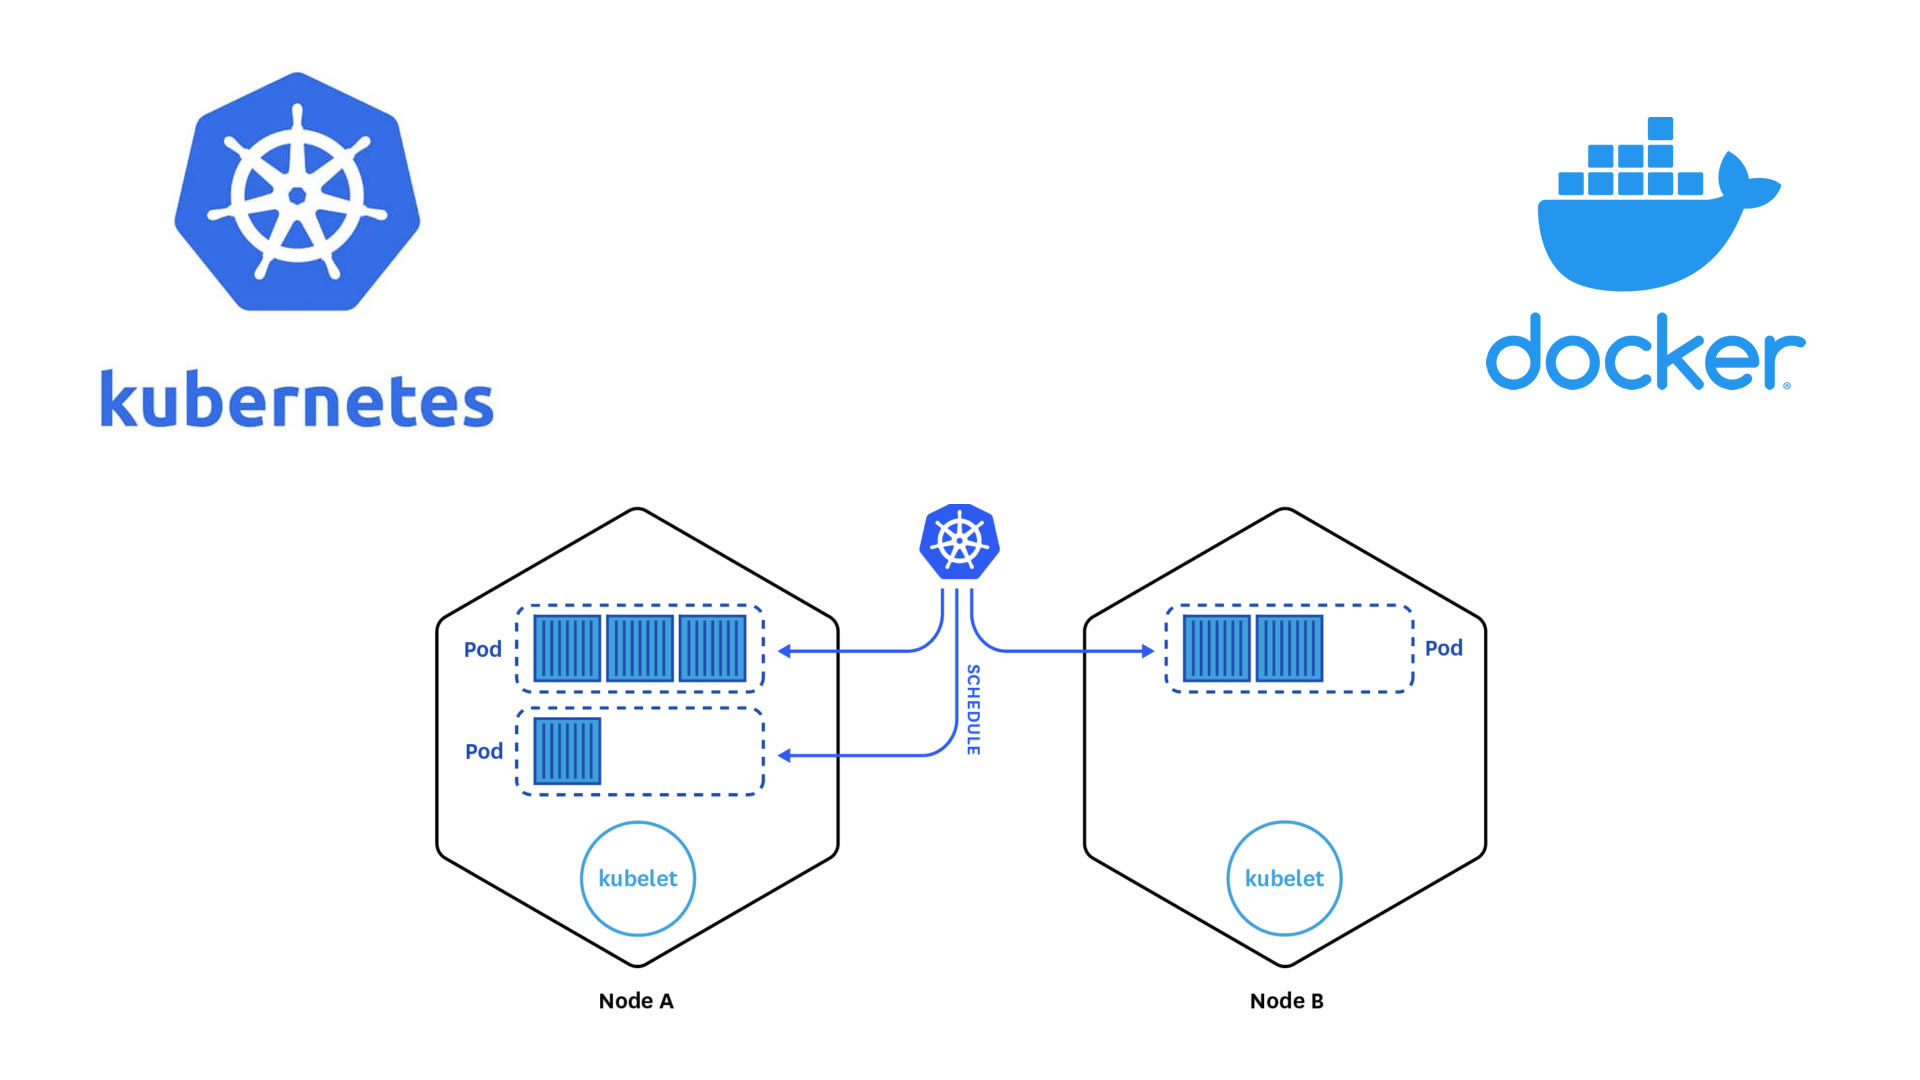
We believe that learning a bit a bout K8s architecture will help you understand better what goes on in the next episodes of this lesson. In simple terms, when you access a cloud K8s cluster you are getting access to a cluster of computers run by Kubernetes . These computers will have main servers (also called control planes) and some worker nodes. The main servers will take care of the bookkeeping and handling of the worker nodes, while the worker nodes will be the ones running your containers (spoiler alert, each container is essentially called a pod in the K8s abstraction). As a matter of fact, you should think of the K8s cluster not as one of usual physical machines, but a cluster of pods running on physical machines.
Take into account that K8s commercial clusters were built with software and application developers in mind. They are mostly used to run services like web pages with database access, apps, etc., but the technology works well for our needs, i.e., sending batch jobs, maybe performing some additional steps, and getting some output.
Plese watch this video, which will explain the basic Kubernetes cluster architecture with a nice analogy:
Key Points
Kubernetes is an orchestrator of containers. It is most useful when it is run in a cluster of computers
Commercial K8s clusters are a good option for large computing needs.
We can run our containerized CMSSW jobs and subsequent analysis workflows in a K8s cluster.
See you tomorrow
Overview
Teaching: 0 min
Exercises: 0 minQuestions
Key question (FIXME)
Objectives
First learning objective. (FIXME)
FIXME
Key Points
First key point. Brief Answer to questions. (FIXME)
Demo: Creating a cluster
Overview
Teaching: 20 min
Exercises: 0 minQuestions
What are the basic concepts and jargon I need to know?
Do do I manually create a K8s cluster on the GCP
Objectives
Learn a few words and concepts that will be used during this lesson
Lear how to create a K8s cluster from scratch
Introduction
In this demonstration we will show you the very basic way in which you can create a computer cluster (a Kubernetes cluster to be exact) in the cloud so you can do some data processing and analysis using those resources. In the process we will make sure you learn about the jargon. During the hands-on session tomorrow, a cluster similar to this one will be provided to you for the exercises.
Basic concepts
The Google Cloud Platform (GCP)
A place on the web that interfaces the user with all the different services that google provide on the cloud.

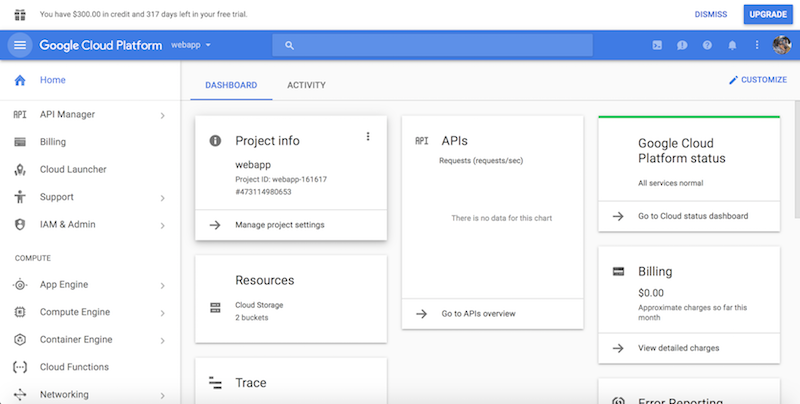
GCP Console
The exact name of the GCP interface where you can explore all the different services that GCP provides. They include, but are not limited to individual virtual machines, disk storage, kubernetes clusters, etc.
Google Kubernetes Engine
A Google service to create Kubernetes clusters and run conteinerized application and/or jobs/workflows.
Kubernetes (K8s)
Software which orchestrates containers in a computer cluster. You already had a chance to learn about its architecture.

Workflow
A series of sequential operations in order to achieve a final result. In our case it could be, for instance
skimming -> merging output files -> EventLoop analysis of resulting files -> Plottin histograms
In the context of the cloud, they are written in yaml files.
Pod
The smallest abstraction layer in a K8s cluter. For any practical purposes, a pod is an abstraction of a container running in the K8s cluster.
Deployment
This is an abstraction layer which is above pods. In practice, you always create deployments in K8s, not pods.
Argo
Argo Workflows is an open source container-native workflow engine for orchestrating parallel jobs on Kubernetes.
Creating your own cluster on GKE
For the hands-on part of this lesson you will not have to create the cluster for yourself, it will be already done for you. For pedagogical reasons, however, we will show an example of how to do it by hand. The settings below should be good and cheap enough for CMSSW-related workflows.
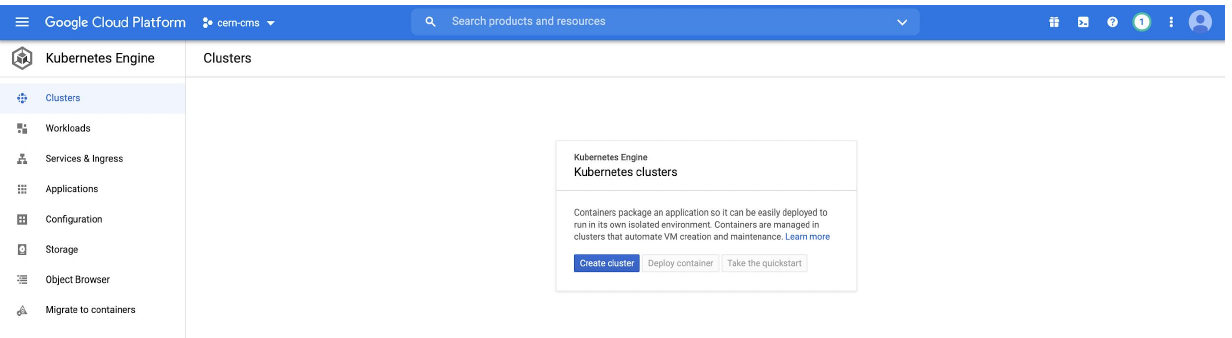
- Get to the Console
- Create a new project or select one of your interest (if you already have one)
- Click on the Kubernetes engine/clusters section on the left side menu

- Select create cluster (standard)
- Give it a name
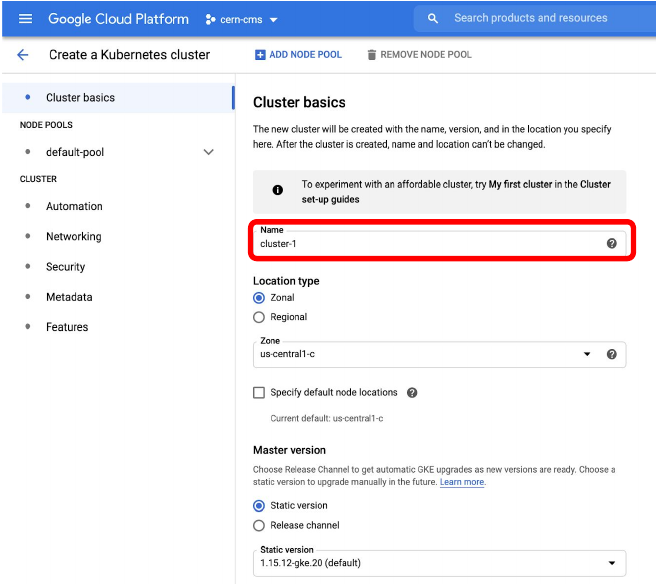
- Many ways to configure the cluster, but let’s try an efficient one with autoscaling
- Go to default pool
- Choose size: 1 node
- Autoscaling 0 to 4
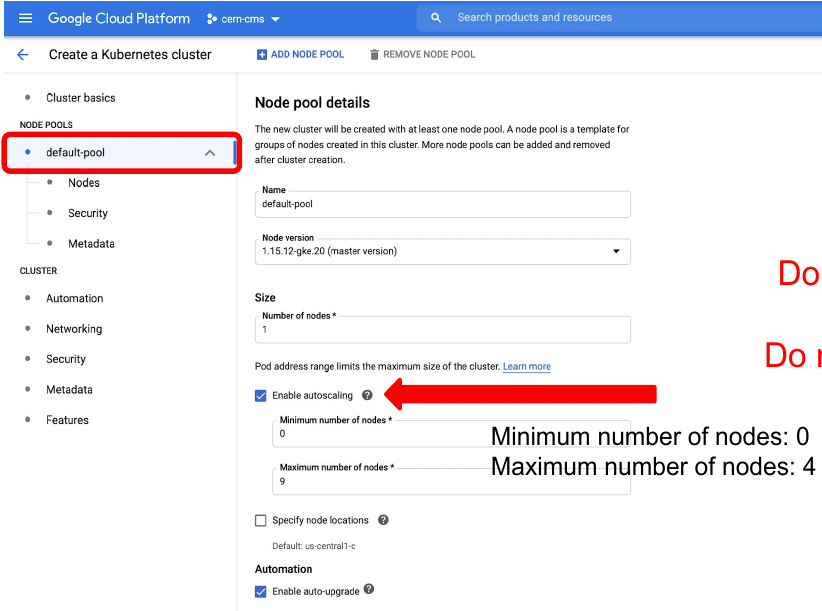
- Go to Nodes
- Choose a machine e2-standar-4
- Leave the rest as it is
- Hit create

- Creation will take while
While we wait, lets inspect the Cloud shell…
Cloud shell
GCP provides an access machine so you can interact with their different services, including our newly created K8s cluster. This machine (and the terminal) is not really part of the cluster. As was said, it is an entry point. From here you could connect to your cluster.

- Get verified for login, type:
gcloud auth loginThen follow the proceure for the verification.
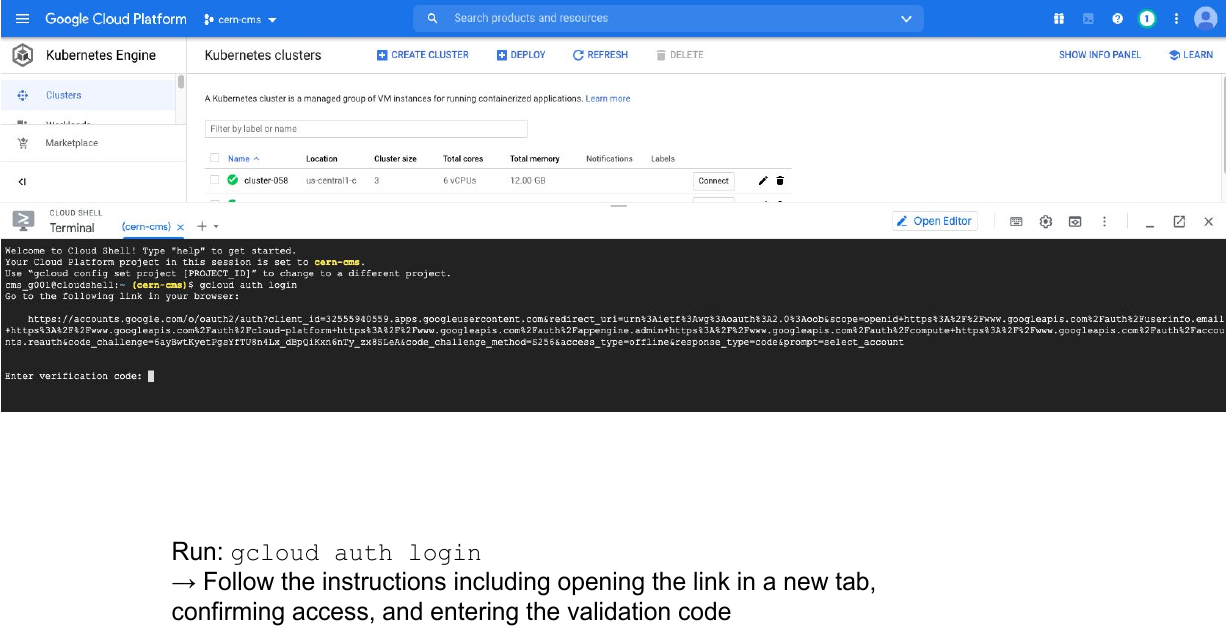
This is something you will have to do only once. For the hands-on part of the lesson, it is likely that you were already authenticated.
The gcloud command
The gcloud command-line interface is the primary CLI tool to create and manage Google Cloud resources. You can use this tool to perform many common platform tasks either from the command line or in scripts and other automations.
Connect to your cluster
Once the cluster is ready (green check-mark should appear)
-
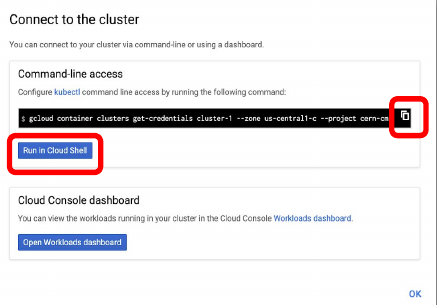
Click on the connect button of your cluster:

-
Execute that command in the cloud shell:
Key Points
It takes just a few clicks to create you own K8s cluster
Kubectl and additional tools and services
Overview
Teaching: 20 min
Exercises: 0 minQuestions
What is kubectl?
What is Argo workflows?
What kind of services/resources will I need to instantiate in my cluster?
Objectives
Lear what the kubectl command can do
Appreciate the necessity for the Argo workflows tool (or similar)
Lear how to set up different services/resources to get the most of your cluster
The kubectl command
Just as gcloud is the one command to rule them all for the GCP, the kubectl command is the main tool for interacting with your K8s cluster. You will use it to do essentially anything in the cluster. Here is the official cheatsheet, which is very useful but already very long.
Let’s run a few examples.
- Get the status of the nodes in your cluster:
kubectl get nodes
- Get the cluster info:
kubectl cluster-info # Display addresses of the master and services
Let’s list some kubernetes components:
- Check pods
kubectl get pod
- Check the services
kubectl get services
We don’t have much going on. Let’s create some components.
- Inspect the
createoperation
kubectl create -h
Note there is no pod on the list, so in K8s you don’t create pods but deployments. These will create pods, which will run under the hood.
- Let’s create an application, it does not matter which. Let’s go for
nginx:
kubectl create deployment mynginx-depl --image=nginx
The nginx image will be pulled down from the Docker Hub.
This is the most minimalist way of creating a deployment.
- Check the deployments
kubectl get deployment
- Check pods
kubectl get pod
Yaml Files
Another way of creating components in a K8s cluster is trough yaml files. These are intuitive, logical and configurable, although very picky about identation.
Let’s take a look at one of these files, nginx-deployment.yaml:
apiVersion: apps/v1
kind: Deployment
metadata:
  name: nginx-deployment
  labels:
    app: nginx
spec:
  replicas: 2
  selector:
    matchLabels:
      app: nginx
  template:
    metadata:
      labels:
        app: nginx
    spec:
      containers:
      - name: nginx
        image: nginx:1.16
        ports:
        - containerPort: 8080
Let’s delete our previous deployment and deploy using the yaml file:
- Delete deployments
kubectl delete deployment mynginx-depl
- Deploy using yaml files
kubectl apply -f nginx-deployment.yaml
Namespaces
Namespaces are a kind of reservations in your K8s cluster. Let’s create one for the Argo workflow we will user
kubectl create ns <NAMESPACE>
Argo
While jobs can also be run manually, a workflow engine makes defining and submitting jobs easier. In this tutorial, we use argo quick start page to install it:
kubectl create clusterrolebinding YOURNAME-cluster-admin-binding --clusterrole=cluster-admin --user=YOUREMAIL@gmail.com
kubectl create ns argo
kubectl apply -n argo -f https://raw.githubusercontent.com/argoproj/argo-workflows/stable/manifests/quick-start-postgres.yaml
Download argo CLI:
# Download the binary
curl -sLO https://github.com/argoproj/argo-workflows/releases/download/v3.1.2/argo-linux-amd64.gz

# Unzip
gunzip argo-linux-amd64.gz

# Make binary executable
chmod +x argo-linux-amd64

# Move binary to path
sudo mv ./argo-linux-amd64 /usr/local/bin/argo

# Test installation
argo version
Run a simple test flow:
argo submit -n argo --watch https://raw.githubusercontent.com/argoproj/argo-workflows/master/examples/hello-world.yaml
argo list -n argo
argo get -n argo @latest
argo logs -n argo @latest
Storage volumes
If we run some application or workflow, we usually require a disk space where to dump our results. There is no persistent disk by default, we have to create it.
You could create a disk clicking on the web interface above, but lets do it faster in the command line.
Create the volume (disk) we are going to use
gcloud compute disks create --size=100GB --zone=us-central1-c gce-nfs-disk-1
Set up an nfs server for this disk:
wget https://cms-opendata-workshop.github.io/workshop2021-lesson-cloud/files/001-nfs-server.yaml
kubectl apply -n argo -f 001-nfs-server.yaml
Set up a nfs service, so we can access the server:
wget https://cms-opendata-workshop.github.io/workshop2021-lesson-cloud/files/002-nfs-server-service.yaml
kubectl apply -n argo -f 002-nfs-server-service.yaml
Let’s find out the IP of the nfs server:
kubectl get -n argo svc nfs-server |grep ClusterIP | awk '{ print $3; }'
Let’s create a persisten volume out of this nfs disk. Note that persisten volumes are not namespaced they are available to the whole cluster.
We need to write that IP number above into the appropriate place in this file:
wget https://cms-opendata-workshop.github.io/workshop2021-lesson-cloud/files/003-pv.yaml
apiVersion: v1
kind: PersistentVolume
metadata:
  name: nfs-1
spec:
  capacity:
    storage: 100Gi
  accessModes:
    - ReadWriteMany
  nfs:
    server: <Add IP here>
    path: "/"
Deploy:
kubectl apply -f 003-pv.yaml
Check:
kubectl get pv
Apps can claim persistent volumes through persistent volume claims (pvc). Let’s create a pvc:
wget https://cms-opendata-workshop.github.io/workshop2021-lesson-cloud/files/003-pvc.yaml
kubectl apply -n argo -f 003-pvc.yaml
Check:
kubectl get pvc -n argo
Now an argo workflow coul claim and access this volume with a configuration like:
# argo-wf-volume.ysml
apiVersion: argoproj.io/v1alpha1
kind: Workflow
metadata:
  generateName: test-hostpath-
spec:
  entrypoint: test-hostpath
  volumes:
    - name: task-pv-storage
      persistentVolumeClaim:
        claimName: nfs-<NUMBER>
  templates:
  - name: test-hostpath
    script:
      image: alpine:latest
      command: [sh]
      source: |
        echo "This is the ouput" > /mnt/vol/test.txt
        echo ls -l /mnt/vol: `ls -l /mnt/vol`
      volumeMounts:
      - name: task-pv-storage
        mountPath: /mnt/vol
Now the workflow could access the disk. However is rather cumbersome to get the ouput outside the cluster. One of he best ways to do that is to follow similar procedures to set up an http web server for example.
As you can see all these tasks take time. The good news is that there are tools to make the cluster creation and the setting up of volumes, pvs, pvcs, servers, services, etc., automatic. This is what we will be doing for you (using Terraform) for the upcoming hands-on part of this lesson.
You will continue learning about this, hands-on, tomorrow, but concentrating on analysis workflows.
Key Points
kubectl is the ruler of GKE
Argo is a very useful tool for running workflows and parallel jobs
To be able to write, read and extract data, a few services/resources need to be set up on the GCP
See you tomorrow
Overview
Teaching: 0 min
Exercises: 0 minQuestions
See you tomorrow for the hands-on activity.
Key Points
Hands-on: Accessing your K8s cluster
Overview
Teaching: 0 min
Exercises: 45 minQuestions
How do I join the GCP project for these hands-on activities?
What GCP resources do I have?
How do I connect to my cluster?
Objectives
Log into the
CMS-opendataproject on the GCPIdentify the different resources and tools that come pre-installed with your cluster
Learn how to connect to your cluster
Introduction
Sign-in instructions
As it is possible to automate the process of creating resources in the cloud, we have built all the required resources for this tutorial in a GCP Project.
Here you will find some instructions on how to join this project, called
CMS-opendata, on the GCP. Please do follow that procedure in order for you to have access to your K8s cluster.
Your K8s cluster
Every one of you will have your own Kubernetes cluster already created. Remember we went through the trouble, yesterday, of creating the cluster by hand. We did not even finish because all the needed elements require some time (and knowledge) to be set up. The good news is that we have taken care of that for you.
Your cluster contains all the toys that you need to run some analysis workflow and extract the output. The most relevant are the access to a an abstraction of disk space, called pvc (persistent volume claim), and an http fileserver that will allow you to access from outside the files you will be producing in this disk. Also, some processes (in pods), which belong to this tool called Argo that we mentioned yesterday, are also running already on your cluster. This will allow you to execute workflows for your analysis.
Each participant has a special ID consisting from the first 7 letters of the participant’s email [0-9a-z]. All the resources you will see later reflect this fact:
Resources
- gce-nfs-disk-<ID>
cluster-<ID> (namespace “argo”)
- Deploymet/Service: nfs-server-<ID>
- Deploymet/Service: http-fileserver-<ID>
- Deploymet/Service: argo-server-<ID>
- PV/PVC: nfs-server-<ID>
For example, jo.hn2000@cern.ch has a cluster-john200 in the namespace argo and a process called nfs-server-john200 running on his cluster.
Remember, namespaces are reservations inside a K8s cluster. Argo gets installed within the
argoname space. Other than that, this will not influence our work in any visible way.
Connect to your cluster
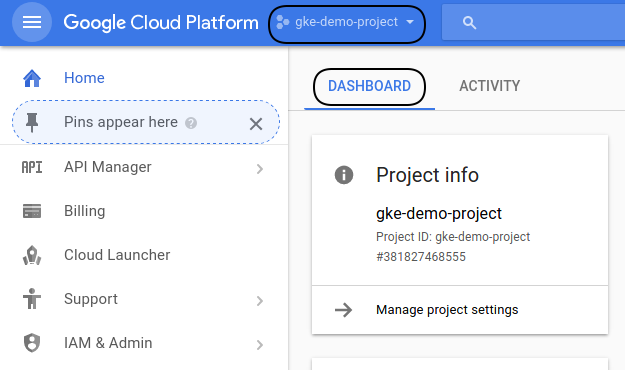
First, notice, by looking at the top of your web browser, that you are already in the GCP CMS-opendata project.
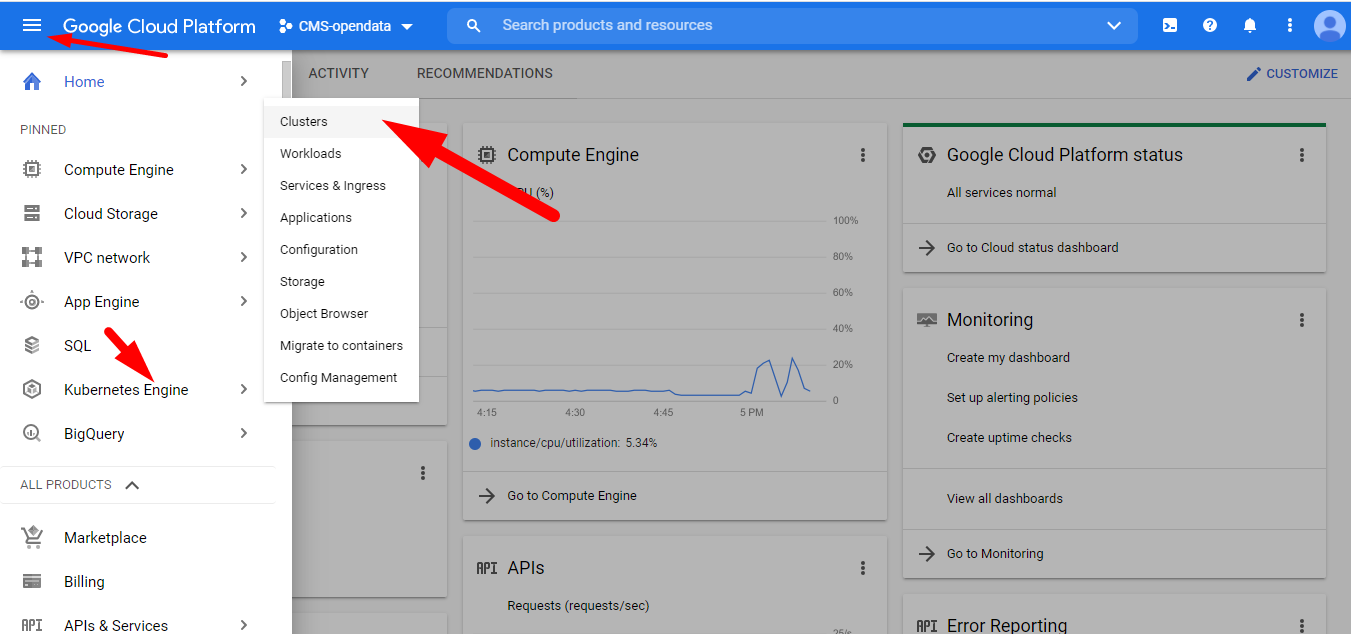
To connect to your cluster we are going to use the GCP CloudShell. Head to GCP > Kubernetes Engine > Clusters:
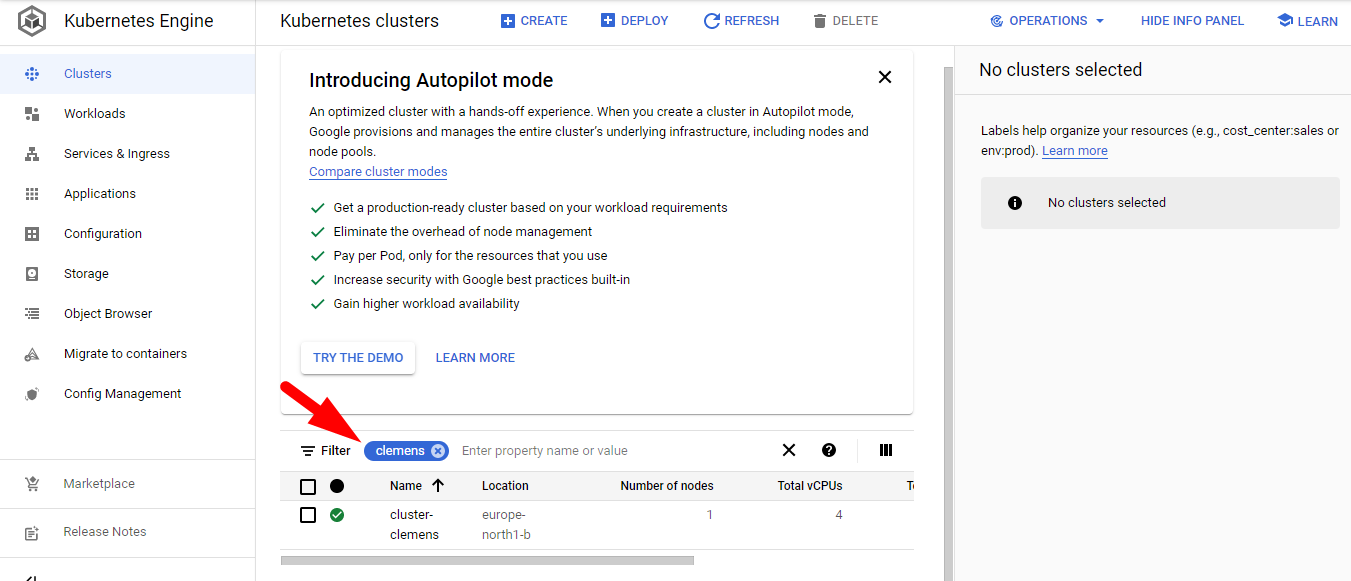
Remember
You can always use the filter with your ID to list only your resources
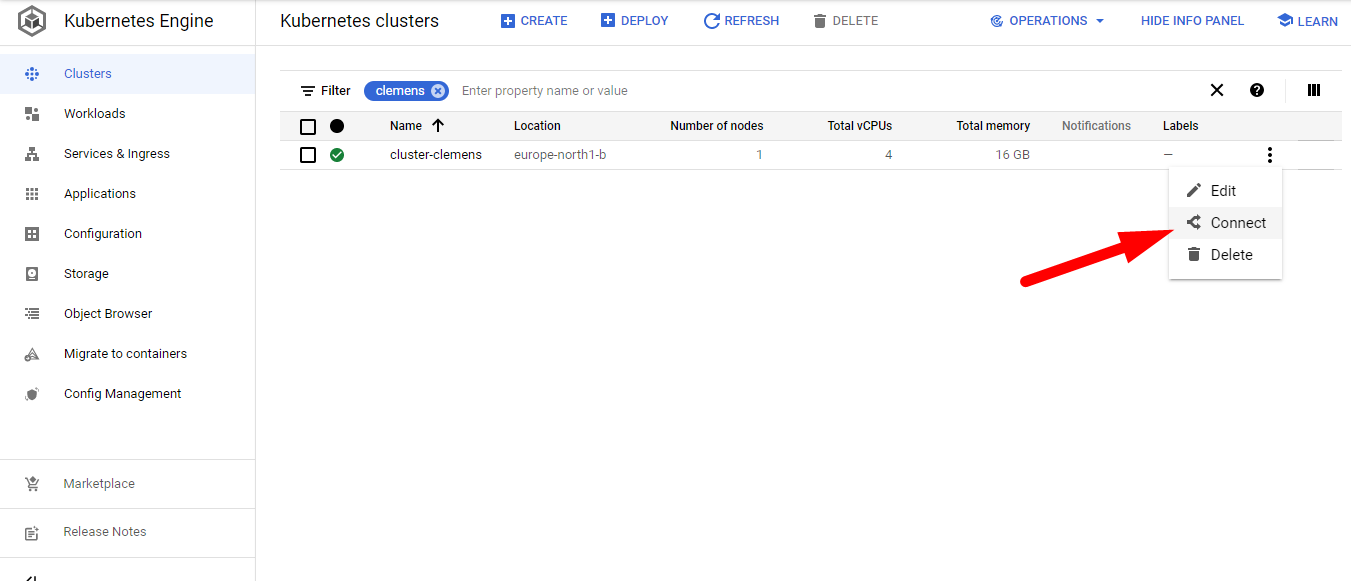
Find your cluster, press connect and choose RUN IN CLOUD SHELL at the emerging window. Then hit enter to execute the gcloud command that will connect you to your cluster.
Press Authorize if prompted to do so.
Getting to know your cluster
Let’s go to the Cloud Shell terminal and run some kubectl commands to verify that all the different resources are actually running on your cluster.
If you get disconnected from the terminal, just hit the Reconnect button.
Check the pods that are running under the namespace argo:
kubectl get pods -n argo
If you forget the namespace declaration,
-n argo, you will get null results. This is because all the elements were created under this namespace (with the exception of thepv, which is not namespaced).
NAME                                       READY   STATUS    RESTARTS   AGE
argo-server-edgarfe-64444f4574-brq7d       1/1     Running   2          10h
http-fileserver-edgarfe-5f8468d9fb-nvljz   1/1     Running   0          10h
minio-edgarfe-58ff684dbd-bbt5t             1/1     Running   0          10h
nfs-server-edgarfe-7ccc5c5fb8-gtbwb        1/1     Running   0          10h
postgres-6b5c55f477-5hqkj                  1/1     Running   0          10h
workflow-controller-7fb47d49bb-6l6wc       1/1     Running   2          10h
Note that there are two instances of the argo-server and its workflow-controller. This is, we presume, to make sure there is always this service available to listen and deal with the requested workflows the client might request.
Now, let’s check the persistent volume, pv, that was created globally (it is not namespaced) as an abstraction for the disk storage infrastructure:
kubectl get pv
NAME          CAPACITY   ACCESS MODES   RECLAIM POLICY   STATUS   CLAIM              STORAGECLASS   REASON   AGE
nfs-edgarfe   100Gi      RWX            Retain           Bound    argo/nfs-edgarfe   standard                12h
Our workflows will be claiming this persistent volume through a persistent volume claim, pvc, that has been also created for us in our argo namespace. Let’s check:
kubectl get pvc -n argo
NAME          STATUS   VOLUME        CAPACITY   ACCESS MODES   STORAGECLASS   AGE
nfs-edgarfe   Bound    nfs-edgarfe   100Gi      RWX            standard       10h
The Bound STATUS reflects the fact that is linked to the pv. A pvc can be claiming all the disk space available in the pv or only a fraction of it. In this case, we are claiming the whole disk: 100Gi.
Take note of the NAME of the
pvcas this will need to be referenced when trying to write to the disk it is linked to. Make sure you replace the name of the examples in this tutorial with the name of your own pvc.
Check the services running and the associated IP addresses:
kubectl get svc -n argo
NAME                          TYPE           CLUSTER-IP       EXTERNAL-IP     PORT(S)                      AGE
argo-server-edgarfe           LoadBalancer   10.122.199.159   34.88.193.217   2746:30307/TCP               10h
http-fileserver-edgarfe       LoadBalancer   10.122.206.111   35.228.53.183   80:32703/TCP                 10h
minio-edgarfe                 ClusterIP      10.122.201.144   <none>          9000/TCP                     10h
nfs-server-edgarfe            ClusterIP      10.122.206.212   <none>          2049/TCP,20048/TCP,111/TCP   10h
postgres                      ClusterIP      10.122.202.183   <none>          5432/TCP                     10h
workflow-controller-metrics   ClusterIP      10.122.199.13    <none>          9090/TCP                     10h
Take note of the
EXTERNAL-IPaddress for thehttp-fileserveras this is the address you will point your browser to in order to access any output files written to the mounted volumes.
You can point your browser to this IP address right now. You will find a familiar but empty tree structure. Your files will arrive there if written to the volumen(s) mounted with the pvc:

To remember
When exposing a server like this, with a public IP address, you get charged on GCP for the outgoing and incoming traffic.
Also take note of the
EXTERNAL-IPaddress for theargo-server..
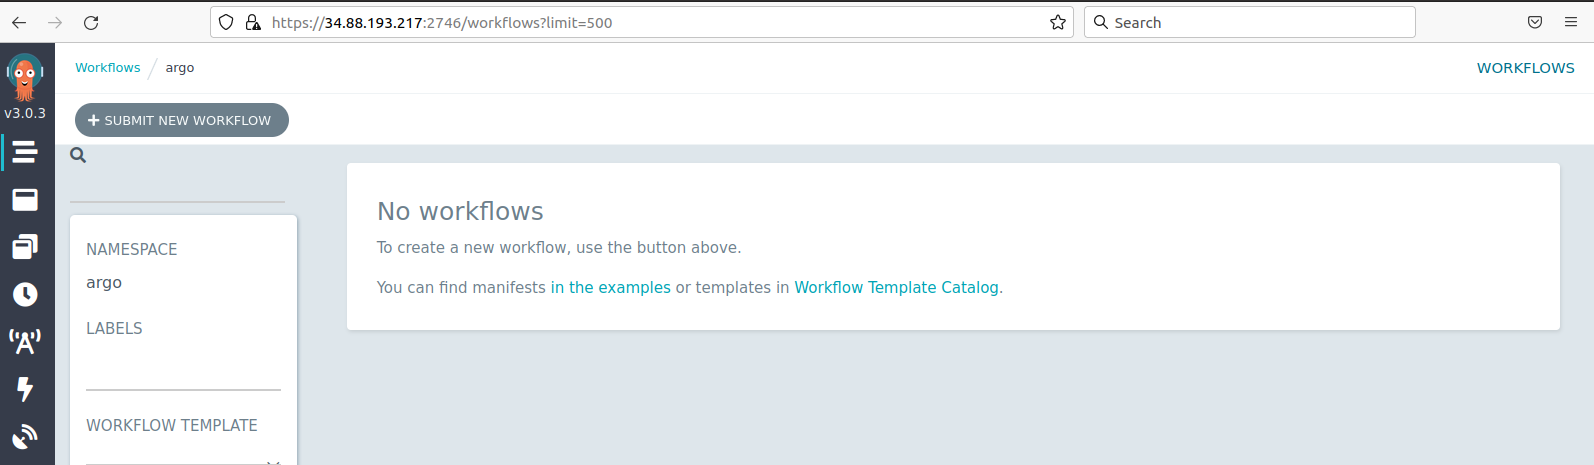
If you point your browser to that IP address, formatted in this way https://34.88.193.217:2746 (replace your own IP; the port is always 2746), you will get access to the Argo GUI. It is a nice application to monitor you workflows. We will check it out later.
Do not mind the minio and the postgres processes, they come with the setup, but we are not going to use them.
Key Points
Once a cluster is created on the Kubernetes Engine, it is really simple to explore its elements.
Connection to the cluster can be achieved using the Cloud Shell.
Break
Overview
Teaching: 0 min
Exercises: 0 minQuestions
Let’s go for a break!
Key Points
Hands-on: Running and understanding Argo workflows
Overview
Teaching: 0 min
Exercises: 40 minQuestions
How are Argo workflows configured?
What are the main ingredients of an Argo yaml workflow file?
Objectives
Learn about the basic structure of Argo yaml workflow files
Learn how to put together differt steps in a workflow and make them run in series
Run a simple Argo workflow
In order to understand the logic of yaml files, and to watch a simple Argo workflow take place, let’s use this simple exmple. Download it your Cloud Shell terminal with:
wget https://cms-opendata-workshop.github.io/workshop2021-lesson-cloud/files/argo-wf-volume.yaml
Edit it with nano or, even better, using the incorporated editor from the console (just click on the Open Editor button). Change the <ID> int the nfs-<ID> string to yours (remember this nfs-
#argo-wf-volume.yaml
apiVersion: argoproj.io/v1alpha1
kind: Workflow
metadata:
  generateName: test-hostpath-
spec:
  entrypoint: test-hostpath
  volumes:
    - name: task-pv-storage
      persistentVolumeClaim:
        claimName: nfs-<ID>
  templates:
  - name: test-hostpath
    script:
      image: alpine:latest
      command: [sh]
      source: |
        echo "This is the ouput" > /mnt/vol/test.txt
        echo ls -l /mnt/vol: `ls -l /mnt/vol`
      volumeMounts:
      - name: task-pv-storage
        mountPath: /mnt/vol
Before we submit this workflow, let’s try to understand what this configuration is doing.
Indentation
yamlfiles are very picky about indentation: they have to, it is how they organize themselves. Everything aligned under a certain level, corresponds to the same organizational block. Be careful not to accidentally perturb this structure.
If you start reading it from top to bottom:
- the first thing you would notice is some general information about the
apiVersionit is using to communicate to the K8s framework (in this caseargoproj.io/v1alpha1), - the
kindof configuration it is (in this case aWorkflow) - and some
metadata, which includes agenerateNamethat will be used to identify its products (that is basically the reason why, in this case,test-hostpath-was defined with an extra-, so if it precedes filenames, it will nicely form a string name).
The spec is the blue print of whole deployment. It starts at an entrypoint. It is literally the place where the workflow will start processing routines. In this case, the entrypoint is test-hostpath (you can give any name to these variables but they have to be consistent with the logic of the yaml). We have to jump down to find its definition under templates. You may recognize that this template is a template of a routine or action. These templates are identified by their names, and usually have a script, which are the commands that will be executed. This script needs to perform through a container (after all K8s is all about containers) and so it calls the corresponding container image to be downloaded. In the present case, the container will be just a simple alpine:latest linux container. Whatever commands are at the source tag will be executed through this container. Also, this template has a volumeMounts, which works very similar to what we have been doing with our own container, i.e., mounting whatever persistentVolumeClaim disk was defined in the volumes section of the spec, in this case nfs-<ID> (our pvc, remember?), at the /mnt/vol directory mountPath.
apiVersions seem to change from time to time, so, sometimes, that will render your yaml config file obsolete and you will have to update the api information.
Let’s submit our workflow:
argo submit -n argo argo-wf-volume.yaml
Yep, it fails:
-bash: argo: command not found
This is because, even though we have the Argo server and its workflow-controller running, we don’t have the CLI to interact with it. Let’s download Argo CLI:
# Download the binary
curl -sLO https://github.com/argoproj/argo-workflows/releases/download/v3.1.2/argo-linux-amd64.gz

# Unzip
gunzip argo-linux-amd64.gz

# Make binary executable
chmod +x argo-linux-amd64

# Move binary to path
sudo mv ./argo-linux-amd64 /usr/local/bin/argo

# Test installation
argo version
You will see somethin like:
argo: v3.1.2
  BuildDate: 2021-07-15T21:53:44Z
  GitCommit: 98721a96eef8e4fe9a237b2105ba299a65eaea9a
  GitTreeState: clean
  GitTag: v3.1.2
  GoVersion: go1.15.7
  Compiler: gc
  Platform: linux/amd64
Ok, now we are truly ready to submit the workflow. Let’s try again:
argo submit -n argo argo-wf-volume.yaml
If you check the status with:
argo list -n argo
you will first see something like:
NAME                  STATUS    AGE   DURATION   PRIORITY
test-hostpath-r5wpg   Running   22s   22s        0
but then
NAME                  STATUS      AGE   DURATION   PRIORITY
test-hostpath-r5wpg   Succeeded   29s   24s        0
when is finished.
If you were paying attention, this workflow should have written a test.txt file to our disk (which is visible externally through our http fileserver). Aren’t you eager to check whether you were able to produce it successfully? Point your browser to the corresponding IP address. In our case:
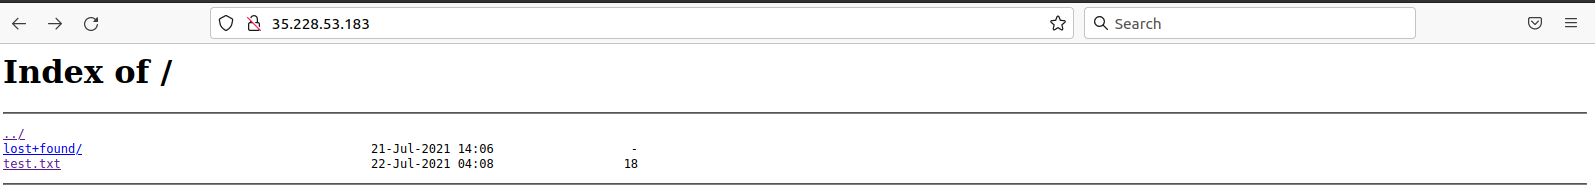
we succeded!
Let’s also the check the Argo GUI:

If you click on the name, you can see a sort of workflow diagram. Ok, in this case our workflow was more like a single task. Let’s make things a little bit more interesting.
Let’s spice things up
Now we are going to run some serious workflow. What we will be doing here is to mimic a full analysis flow (so, it is a full workflow) of essentially what we did already during the workshop.
We will start by automatically getting the list of files from the cern open portal with the containerized cernopendata-client tool.
Then we will generate a list of those files that we want to process; we will then run a version of the POET code, then merge the output files into a single ROOT file and finally run a simplified version of the EventLoopAnalysisTemplate to obtain a test histogram to see if everything went well.
Dowload the yaml file with:
wget https://raw.githubusercontent.com/cms-opendata-workshop/workshop2021-poetpayload-cloud/master/PhysObjectExtractor/cloud/workshop_argo.yaml
Inspect it carefully and try to make sense of logic. This is a good time to ask the experts in the room!
Submit your workflow and get the results.
You can open the http file server assigned to your cluster to see the histogram file and to download the merged output file poetoutput.root
Will you be able to change the workflow file to process the dataset of your choice?, the numebr of files of your choice?, etc.? Note that to run over all events in each file, you can set the number of events to -1.
Key Points
With a simple but a tight yaml structure, a full-blown analysis can be performed using the Argo tool on a K8s cluster.