Introduction
Overview
Teaching: 5 min
Exercises: 5 minQuestions
How to get to your cluster?
How to get ready to submit the workflow?
Objectives
Get your GCP environment ready to run an argo workflow
Scale your cluster up to 4 nodes
Get the tools running to observe the working processes
Access your GKE Cluster
For the CMS-Workshop 2022 we have added you to a GCP project where we will provide temporary resources to run an Argo Workflow. Before we get into details please follow the following steps to get things started!
Find your cluster
- Go to the Google Cloud Console and login with your google account.
- Verify that you are in the CMS-opendata Project.

- Go the Kubernetes engines cluster listing from the Navigation menu top left, scroll down to “Kubernetes engine” and select “Clusters”.

- Find the number of your cluster in the email you have received and select your cluster in the list.
Resize your cluster
The cluster has been created with one node only to limit the costs. Now as you start using the cluster, resize your cluster to 4 nodes:
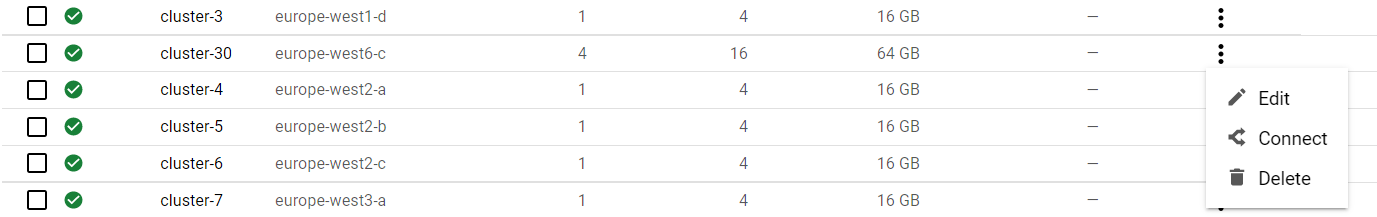
- Click on the three vertical dots after your cluster name and select “Edit”.

- Choose Nodes.

- Then click on the Node pools name “terraform…”.
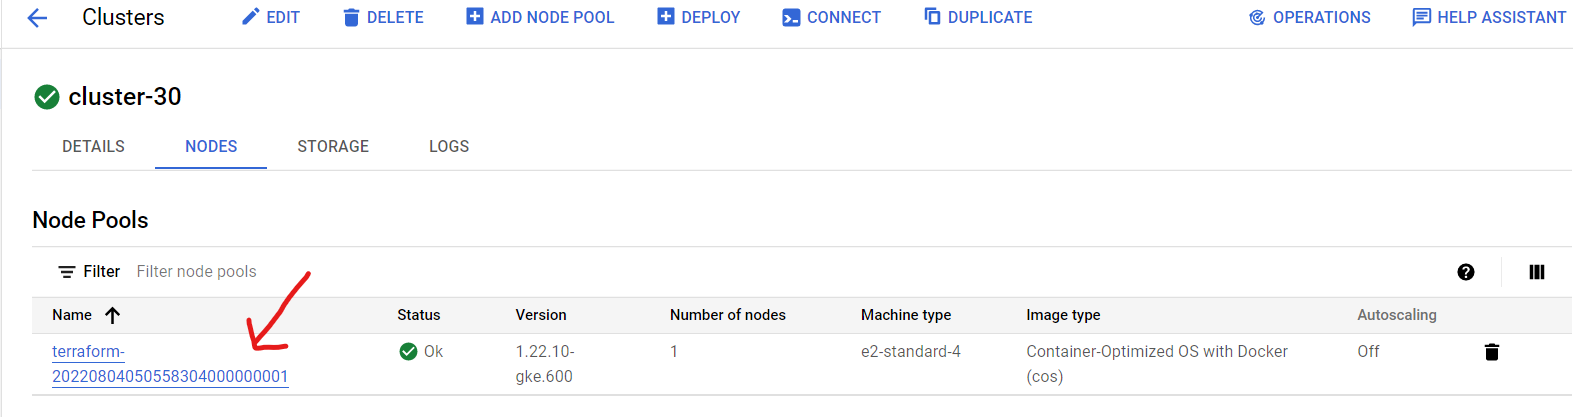
- Select “Resize”.
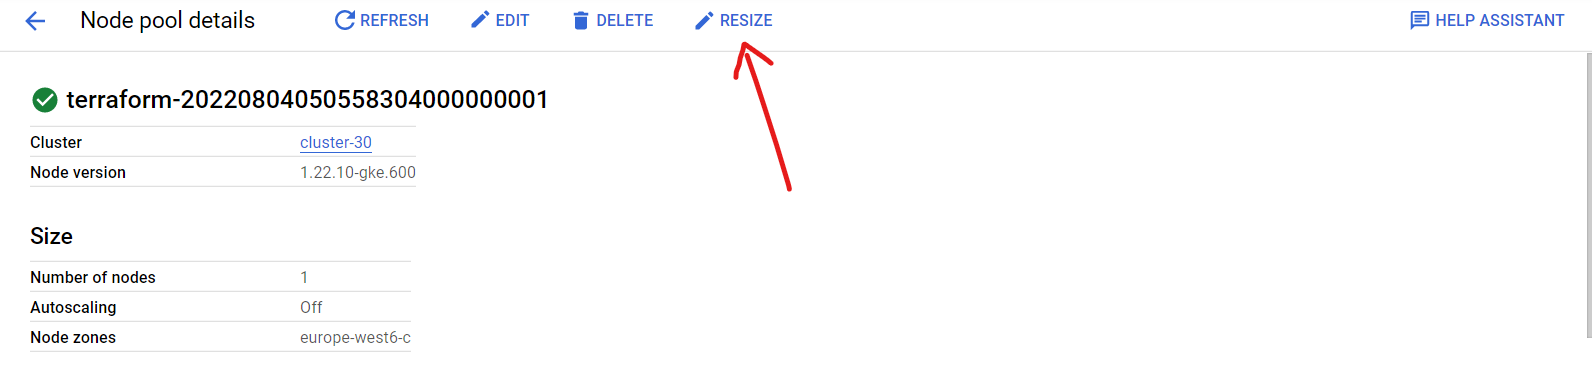
- Set the number of nodes to 4.

Connect to the cluster
- Now go back to the cluster listing page, click on the three vertical dots and choose connect.
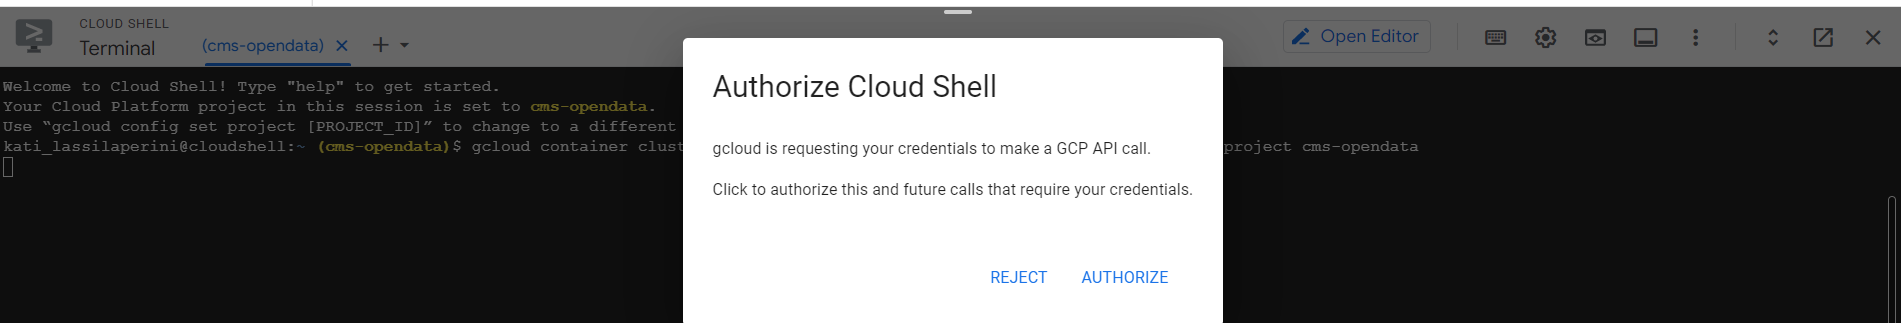
- Click on “RUN IN CLOUD SHELL” to connect to your cluster.

- In the cloud shell press Enter after the command and authorize cloud shell in the pop-up window that opens
- If requested, submit the command
gcloud auth loginand follow the link the get the authorization code.
Argo
Argo command-line interface
Argo components are already running on the cluster! But to submit the workflow from the cloud shell, you will need the argo command-line interface. You can download the binary and move it to it’s respective path with the following commands:
curl -sLO https://github.com/argoproj/argo-workflows/releases/download/v3.4.7/argo-darwin-amd64.gz
gunzip argo-linux-amd64.gz
chmod +x argo-linux-amd64
sudo mv ./argo-linux-amd64 /usr/local/bin/argo
Submit the workflow
Now fast forward: to make sure that the workflow makes it in time to finish during the hands-on session, submit it right now. We will explain the details while the workflow is running.
Get the workflow file with
wget https://raw.githubusercontent.com/cms-opendata-analyses/PhysObjectExtractorTool/odws2022-ttbaljets-prod/PhysObjectExtractor/cloud/argo-poet-ttbar.yaml
The workflow defines the persistent volume in which the output is stored. Edit the workflow to replace <NUMBER> to correspond to your cluster number.
nano argo-poet-ttbar.yaml
Then submit the workflow with
argo submit argo-poet-ttbar.yaml -n argo
Check that it got running with
argo get @latest -n argo
Get your services
Your cluster has been built altogether with Terraform, including all the configurations seen in the cloud pre-exercises.
To get the external IP of both the Argo GUI (with which you can follow the workflow) and the http server (through which you can download the ouputs), run the following command:
kubectl get svc -n argo
Http File Server
In a new tab open <EXTERNAL-IP>, no need to add anything, just paste the external IP of your http-fileserver-<NUMBER> from the ouput of the command above.
Argo GUI
In a new tab open https://<EXTERNAL-IP>:2746, replacing <EXTERNAL-IP> with corresponding external IP of your argo-server-<NUMBER> from the ouput of the command above.
Next
OK, we got it running! Now let’s go to see the details…
Key Points
You can submit the workflow from the Google cloud shell connected to your cluster.
Demo: Run a Full Analysis Flow
Overview
Teaching: 20 min
Exercises: 45 minQuestions
How do I run an analysis on multiple datasets?
What are the different steps in the example workflow?
Objectives
Mimic a full analysis flow
Understand structure of a workflow
Find the recid for a dataset and put it into the yaml file
Follow the workflow progress
You can watch the progress of the workflow either on the command line or in the Argo GUI.
On the command line, you can see the state of the workflow with
argo get @latest -n argo
and you can check the logs with
argo logs @latest -n argo
When it has finished, you will be able to access the output files from the http file server. You can also see the contents of the disk with
kubectl exec pv-pod -n argo -- ls /mnt/data
Expanding the Yaml File
In the previous section, you downloaded a workflow definition and submitted it. It should be now running. This workflow corresponds to the analysis example presented in this workshop.
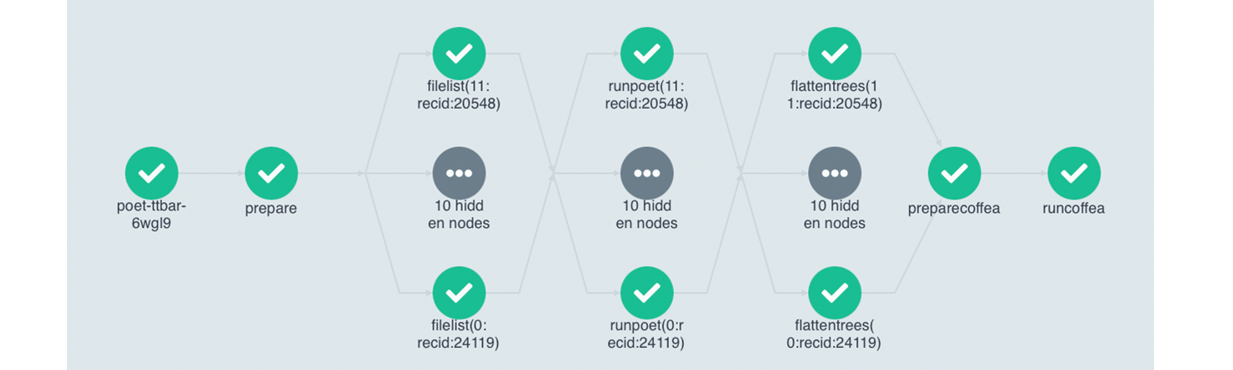
The workflow mimicks a full analysis, first processing CMS open data samples with POET and then running analysis script on the ouput files.
Open up the file argo-poet-ttbar.yaml, and take a look through its contents. Below is an explanation of the major steps.
argo-poet-ttbar.yaml calls and runs multiple different tasks. The file is broken up into different templates. Note that each task runs in a container, and the workflow is using the same container images that we have been using in the workshop.
-
“argo-poet”, the first template, is the entrypoint, and it contains the outline for the rest of the workflow.
-
“prepare-template” gets the directories ready for other workflow steps.
-
“filelist-template” uses
cernopendata-clientto get all files of the datasets. -
“runpoet-template” processes the data, and it will take the longest amount of time to complete.
-
“flattentrees-template” combines the separate “branches” of the POET output ROOT file to one “Events” branch.
-
“preparecoffea-template” prepares the input to the analysis steps.
-
“runcoffea-template” runs the analysis.
The first template must have the same name as the the entrypoint value, which is declared close to the top of the file. Under the dag section of the first template, it calls other templates that are defined below. It also contains information such as arguments to pass into each of these sections and dependencies that ensure the templates are run in the correct order.
The fifth template uses scattering to run the analysis. It runs the code specified within in multiple pods at the same time. The Argo GUI helps us visualize this process.
Depending on the resources you allocate to you cluster, there is a limit to the number of pods you have running at one time. If you have more pods than this number, they will wait for eachother to complete.
Workflow input parameters
The workflow takes the following parameters:
arguments:
parameters:
      - name: nFiles
        value: 2
      - name: recid
        value: |
          [
            {"recid": 24119},
            {"recid": 24120},
            {"recid": 19980},
            {"recid": 19983},
            {"recid": 19985},
            {"recid": 19949},
            {"recid": 19999},
            {"recid": 19397},
            {"recid": 19407},
            {"recid": 19419},
            {"recid": 19412},
            {"recid": 20548}
          ]
      - name: nJobs
        value: 1
They give the input to the workflow steps.
nFilesis the number of files in each dataset you want to process. It is limited to 2 in this workflow. In real analysis you would run over all files.recidis the list of dataset to be processed.nJobsis one (the corresponding job loop has not yet been implemented in the workflow, changing this parameter will only change the first file to be precessed in the file list).
Accessing and using datasets
Tho access the dataset file listing you will need its record number or recid, which can be found in the end of the url of the dataset on the CERN Open data portal. For example, in the dataset shown below, the recid is 24119.

Note that this is just an example workflow for demonstration purposes. The workflows can be customized to fit a variety of needs. Now you are able to edit a yaml file to perform a full analysis flow.
Key Points
You can run an analysis on an entire dataset using multiple templates and scattering
Workflow composition
Overview
Teaching: 10 min
Exercises: 10 minQuestions
How to debug my workflow
How can I test that a step has been made
Analyzing my architecture
Objectives
Learn tools that will help you get a sense of notion of the cluster
Understand your own workflow structure
Testing your pod
So you’ve run a workflow but want to make an analysis of your own, this is not an easy process, but nonetheless doable. Take into consideration the following questions:
- What image suits best my workflow step?
- What’s the estimate amount of resources this will take?
- Am I repeating the same step over and over?
These and many more will haunt you throughout your preperation process, but when you are already understanding your arquitecture is key.
Get a look of everything you’ve got running:
kubectl get all -n argo
Get the amount of nodes your cluster has deployed:
kubectl get nodes
We can get a sense of till what point our workflow is running printing an echo, keep in mind that you musst take into consideration what programming language and version your image works with, for example in bash you can use:
echo "Is running till this point!"
Entering a pod to see what you can do is as simple as adding a sleep after a process you’ve gone through, make sure it’s enough time for you to enter and do the heavy work, say a sleep 120 should be enough.
Once you’ve added a sleep to your workflow step, execute it and with the help of your Agro GUI, you should have an idea of when you’re wrokflow has reached the sleep command.
First get your running pod with:
kubectl get pods -n argo
Next enter this pod to see what is going on or try running what gives you error. You can enter the pod with the following:
kubectl exec --stdin --tty <POD NAME> -n argo -- /bin/bash
Key Points
Testing will no doubtedly bill you