Commonly used features in ROOT
Overview
Teaching: 5 min
Exercises: 7 minQuestions
Which ROOT features am I likely to use in my analysis?
Objectives
Learn about important core features of ROOT
This section is dedicated to the introduction to selected features of ROOT, which we see commonly used in typical day-to-day work and analyses.
Basic histogramming, fitting and plotting
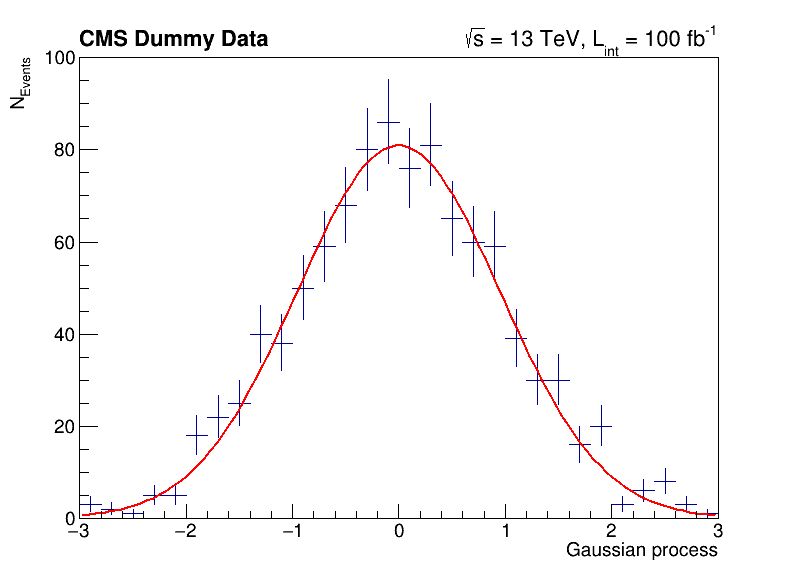
The following script uses basic features from ROOT, which are used commonly in day-to-day work with ROOT. You can investigate the typical workflow to create histograms with TH1F, fit a function to the data with TF1 and produce an accurate visualization with TCanvas and others. Below, you can see the output of the fit to the data with the measured parameters.
import ROOT
import numpy as np

# Make global style changes
ROOT.gStyle.SetOptStat(0) # Disable the statistics box
ROOT.gStyle.SetTextFont(42)

# Create a canvas
c = ROOT.TCanvas('c', 'my canvas', 800, 600)

# Create a histogram with some dummy data and draw it
data = np.random.randn(1000).astype(np.float32)
h = ROOT.TH1F('h', ';Gaussian process; N_{Events}', 30, -3, 3)
for x in data: h.Fill(x)
h.Draw('E')

# Fit a Gaussian function to the data
f = ROOT.TF1('f', '[0] * exp(-0.5 * ((x - [1]) / [2])**2)')
f.SetParameters(100, 0, 1)
h.Fit(f)

# Let's add some CMS style headline
label = ROOT.TLatex()
label.SetNDC(True)
label.SetTextSize(0.040)
label.DrawLatex(0.10, 0.92, '#bf{CMS Dummy Data}')
label.DrawLatex(0.58, 0.92, '#sqrt{s} = 13 TeV, L_{int} = 100 fb^{-1}')

# Save as png file and show interactively
c.SaveAs('dummy_data.png')
c.Draw()
 FCN=30.2937 FROM MIGRAD    STATUS=CONVERGED      67 CALLS          68 TOTAL
                     EDM=1.34686e-08    STRATEGY= 1      ERROR MATRIX ACCURATE
  EXT PARAMETER                                   STEP         FIRST
  NO.   NAME      VALUE            ERROR          SIZE      DERIVATIVE
   1  p0           8.09397e+01   3.19887e+00   7.10307e-03  -3.40988e-05
   2  p1          -3.46483e-03   3.10501e-02   8.47265e-05  -2.30742e-03
   3  p2           9.56532e-01   2.24141e-02   4.97399e-05   2.58872e-03
Info in <TCanvas::Print>: file dummy_data.png has been created
Try it by yourself!
Run the example code by yourself! In case the execution ends without displaying the plot on screen, you can run the script in interpreted mode with
python -i your_script.py. That will keep the process alive after the plot is displayed.

You can exit the python interactive mode with Ctrl + D.
Investigating data in ROOT files
You have already seen the usage of TTree::Draw in the previous section. Such quick investigations of data in ROOT files are typical usecases which most analysts encounter on a daily basis. In the following you can learn about different ways to approach this task!
Manually plotting with TTree::Draw
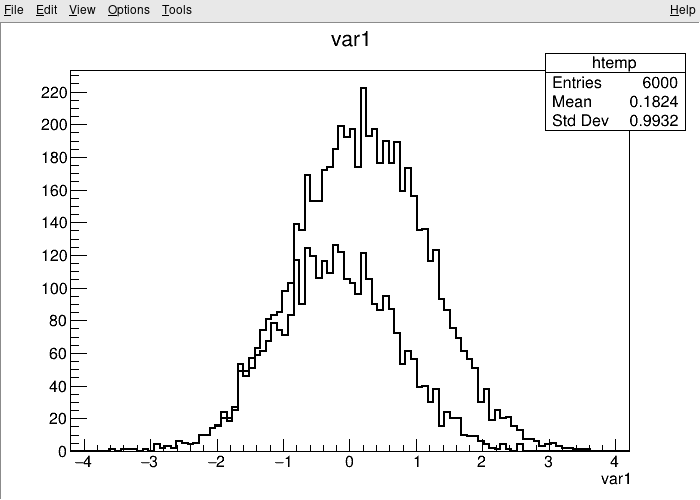
For quick studies on the raw data in a TTree on the command line, you can use TTree::Draw to make simple visualizations:
$ root -l https://root.cern/files/tmva_class_example.root

root [0]
Attaching file https://root.cern/files/tmva_class_example.root as _file0...
(TFile *) 0x558d7b54aa50
root [1] TreeS->Draw("var1") // just draw var1
Info in <TCanvas::MakeDefCanvas>:  created default TCanvas with name c1
root [2] TreeS->Draw("var1", "var2 > var1", "SAME") // draw var1 with the selection var2 > var1
(long long) 3222

The TBrowser
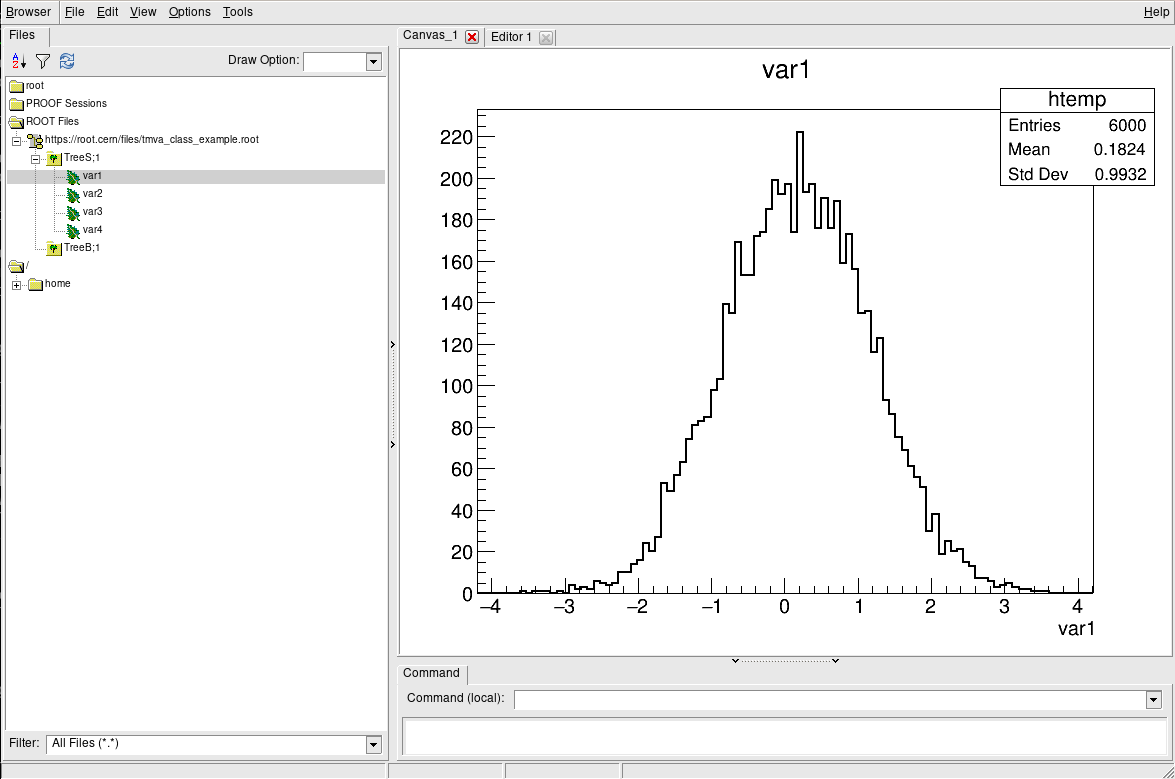
More convenient is using ROOT’s tool for browsing ROOT files, the TBrowser. You can spawn the GUI directly from the ROOT prompt as shown below.
$ root -l https://root.cern/files/tmva_class_example.root

root [0]
Attaching file https://root.cern/files/tmva_class_example.root as _file0...
(TFile *) 0x557892a0ef10
root [1] TBrowser b
(TBrowser &) Name: Browser Title: ROOT Object Browser
The rootbrowse executable
For convenience, ROOT provides the executable rootbrowse, which lets you open a TBrowser directly from the command line and display the files given as arguments!
$ rootbrowse https://root.cern/files/tmva_class_example.root

Other ROOT executables
There are many small helpers shipped with ROOT, which let you operate on data quickly from the command line and solve typical day-to-day tasks with ROOT files.
List of ROOT executables
rootbrowse: Open a ROOT file and a TBrowserrootls: List file content, tree branches, objects’ statsrootcp: Copy objects within a file or between filesrootdrawtree: Simple analyses from the command linerooteventselector: Select branches, events, compression algorithms and extract slimmer treesrootmkdir: Creates a directory in a TFilerootmv: Move objects between filesrootprint: Print objects in plots on filesrootrm: Remove objects from files
$ rootls https://root.cern/files/tmva_class_example.root
TreeB  TreeS
$ rootls -l https://root.cern/files/tmva_class_example.root
TTree  Jan 19 14:25 2009 TreeB  "TreeB"
TTree  Jan 19 14:25 2009 TreeS  "TreeS"
$ rootls -t https://root.cern/files/tmva_class_example.root
TTree  Jan 19 14:25 2009 TreeB  "TreeB"
  var1    "var1/F"    0
  var2    "var2/F"    0
  var3    "var3/F"    0
  var4    "var4/F"    0
  weight  "weight/F"  0
  Cluster INCLUSIVE ranges:
   - # 0: [0, 5998]
   - # 1: [5999, 5999]
  The total number of clusters is 2
TTree  Jan 19 14:25 2009 TreeS  "TreeS"
  var1  "var1/F"  0
  var2  "var2/F"  0
  var3  "var3/F"  0
  var4  "var4/F"  0
  Cluster INCLUSIVE ranges:
   - # 0: [0, 5998]
   - # 1: [5999, 5999]
  The total number of clusters is 2
Try it by yourself!
Feel free to investigate the tools presented here!
More useful features
ROOT is made for HEP analysis and contains many other features that are useful in typical tasks, for example:
- TEfficiency, to handle histograms representing efficiencies and their uncertainties
- THStack, to stack histograms
- TRatioPlot, to create ratio plots with the histograms on the top and the ratio with the correct uncertainties on the bottom
- And many more!
Key Points
ROOT provides many features from histogramming, fitting and plotting to investigating data interactively in C++ and Python