
What is in the datafiles?
Last updated on 2026-07-14 | Edit this page
Estimated time: 10 minutes
Overview
Questions
- How do I inspect these files to see what is in them?
Objectives
- To be able to see what objects are in the data files
In the following, we will learn about CMS data in the NANOAOD format. This is the data format that can be accessed without CMS-specific software using python tools.
NANOAOD variable list
Each NANOAOD dataset has the variable list with a brief description attached to the portal record. You will learn more about the variables for different types of physics objects in the Physics Objects lesson
Challenge: variables
Find the variable listings for a collision data record and a Monte Carlo data record. What are the differences? What is the same?
The data records have a “Luminosity” block with some beam related information whereas MC records have a “Runs” block with event generation information.
The MC records have event generator or simulation information in the “Events” block.
The variables of reconstructed objects, such as Muons, are the same for data and MC.
Inspect datasets with python tools
This part of the lesson uses your local Python environment. Make sure you have the required packages installed (see the Setup page). Start Jupyter Lab with:
Open a new notebook and type the commands in code cells.
First, import some python libraries:
- uproot is a python inteface to ROOT
- matplotlib can be used for plotting
- numpy is a python package for scientific computing
- awkard is a python library for variable-size data
Then, open a file from a dataset:
PYTHON
file = uproot.open("root://eospublic.cern.ch//eos/opendata/cms/Run2016H/SingleMuon/NANOAOD/UL2016_MiniAODv2_NanoAODv9-v1/120000/61FC1E38-F75C-6B44-AD19-A9894155874E.root")Print out event content with python tools
You can check the content blocks of the file with
OUTPUT
{'tag;1': 'TObjString',
 'Events;1': 'TTree',
 'LuminosityBlocks;1': 'TTree',
 'Runs;1': 'TTree',
 'MetaData;1': 'TTree',
 'ParameterSets;1': 'TTree'}
Events is the TTreeobject that contains the
variables of interest to us. Get it from the data with:
You can list the full list of variables with
Now, fetch some variables of interest, e.g. take all muon pt values in an array
Challenge: inspect pt
Find out the type of the pt array. Print values of some of its elements. What do you observe?
Find the type with
OUTPUT
awkward.highlevel.ArrayPrint out some of the values with
OUTPUT
[[23.1], [39.3], [24.1], [91.9, 52.7], ... [88.7, 14.2], [58.9], [27.1], [50]]Note that the muon pt array can contain one or more elements, depending on the number of reconstructed muons in the event.
From the awkward array documentation, you can find out hot to choose the events with exactly two reconstructed muons:
OUTPUT
<Array [[91.9, 52.7], ... [88.7, 14.2]] type='2713 * var * float32'>You can learn about awkward arrays and much more in the HEP Software Foundation Scikit-HEP tutorial.
Plot a variable with python tools
Common python plotting tools cannot handle arrays or arrays with different sizes, such as the muon pt. If you want to plot all muon pts, “flatten” the pt array first:
Now plot the muon pt values with
You could also plot directly ptflat variable, but it you
want to introduce some cuts that need the knowledge that certain values
belong to the same event, you need to do them to the original pt array.
For example, plotting the events with 2 muons:
PYTHON
plt.hist(ak.flatten(pt),bins=200,range=(0,200))
plt.hist(ak.flatten(pt[ak.num(pt) == 2]),bins=200,range=(0,200))
plt.show()
This is what you will see:
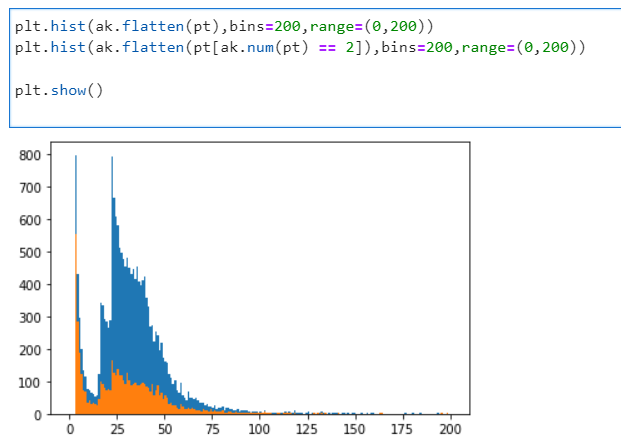
If you’ve chosen another dataset or another file, it will look different.
- It’s useful to inspect the files before diving into the full analysis.
- Some files may not have the information you’re looking for.