
All Images
The Big Picture
Figure 1
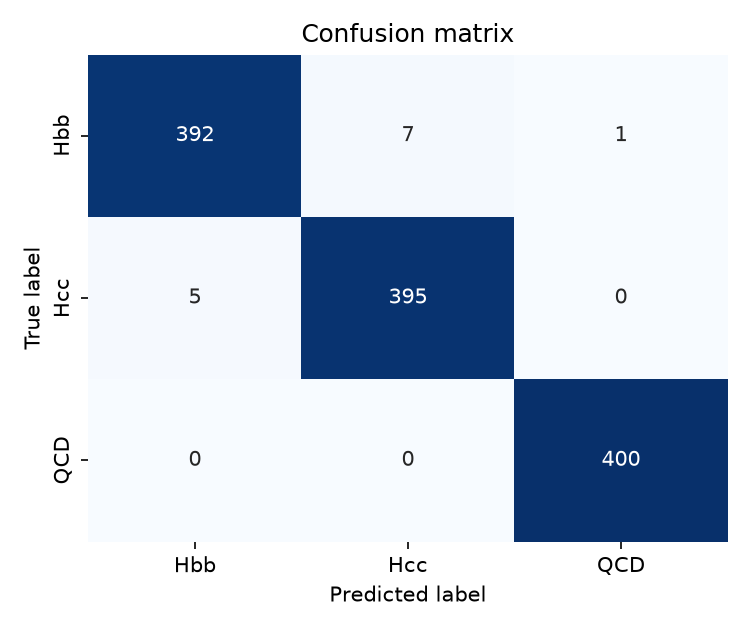
Example confusion matrix for a 3-class
problem.
Figure 2
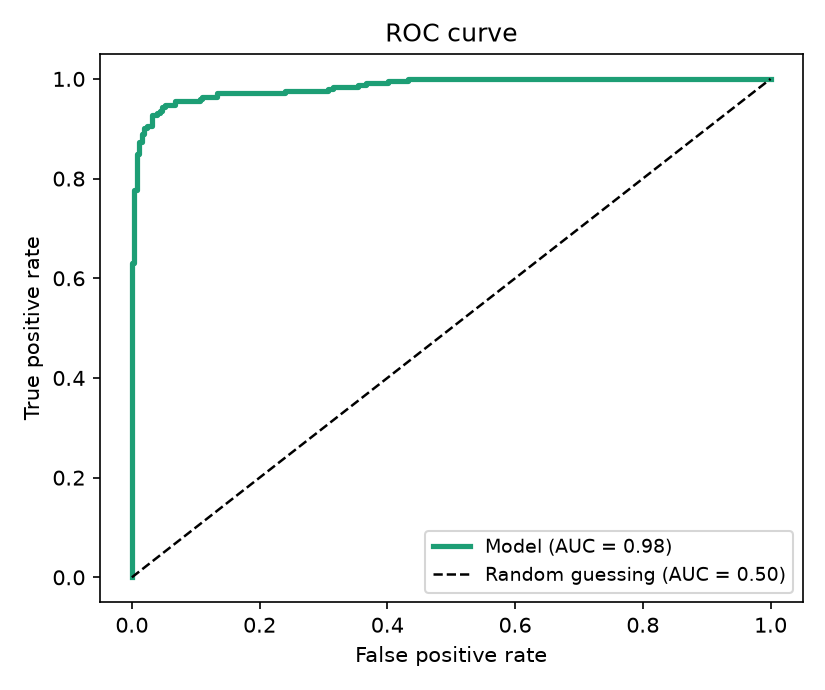
Example ROC curve.
Working in Google Colab
The Complete Code
Figure 1
Confusion matrix from a full 10-epoch training
run of MiniParT.
Figure 2
ROC curves from the same full training
run.
What Is a Jet?
Finding the Truth Labels
Figure 1
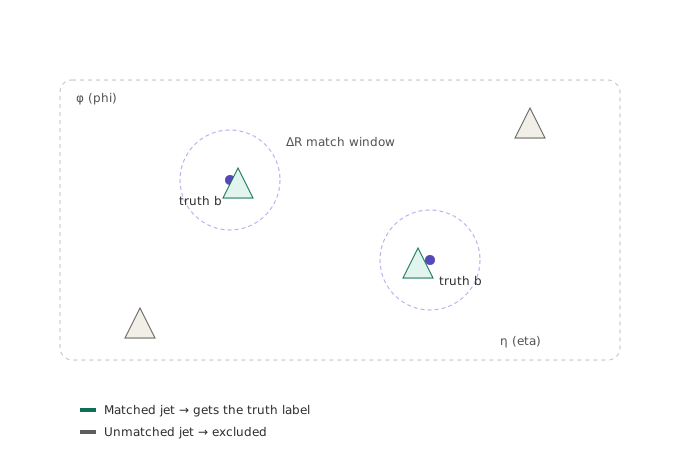
Truth quarks (filled dots) are matched to nearby
reconstructed jets (green triangles) within a ΔR window; jets outside
that window (grey triangles) are unmatched and excluded from
training.
Preparing the Data
Building MiniParT
Training the Model
Evaluating the Model
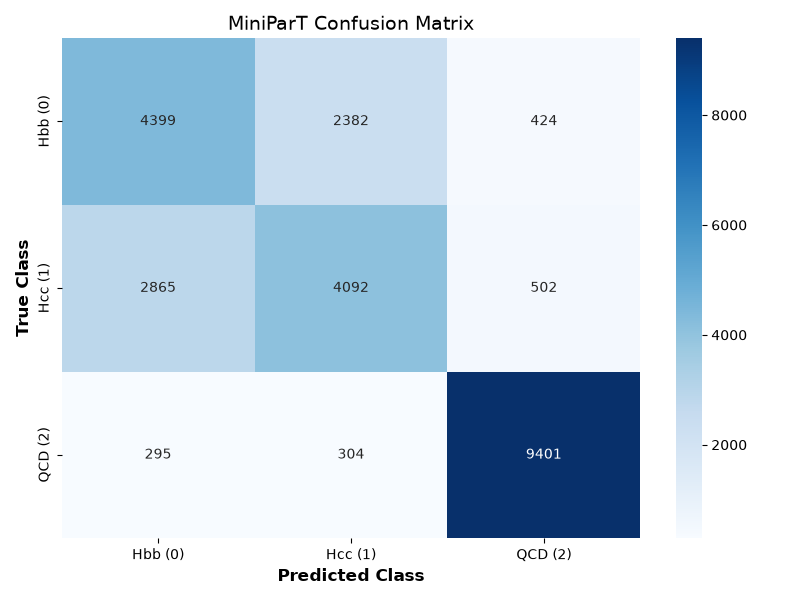
Figure 1
Confusion matrix from a full 10-epoch training
run of MiniParT. QCD is separated cleanly from the two signal classes
(only 295 and 304 events leak into the QCD column), while Hbb and Hcc
are confused with each other far more often (2382 and 2865 events
respectively). This is the Hbb-vs-Hcc difficulty from The Big Picture
episode showing up directly in real results.
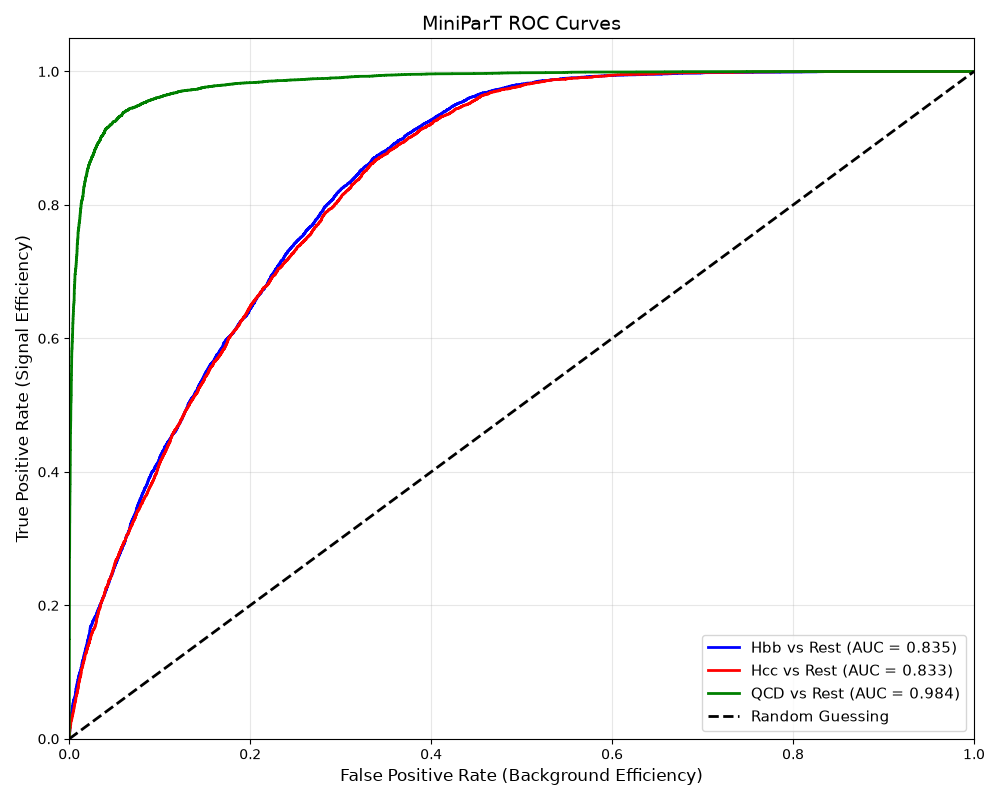
Figure 2
ROC curves from the same full training run. QCD
vs. Rest reaches an AUC of 0.984, close to a perfect classifier, while
Hbb vs. Rest (0.835) and Hcc vs. Rest (0.833) are close to each other
and noticeably lower. The two signal curves nearly overlap across the
whole plot, another way of seeing that the model finds Hbb and Hcc
harder to separate from each other than either is to separate from
QCD.