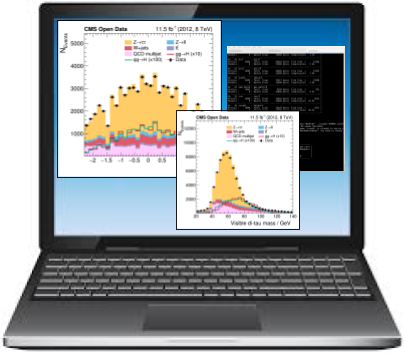
This exercise will walk you through the process of making some basic plots, once you have skimmed some data and produced ROOT files. We’ll make these plots using ROOT and calling ROOT from python using the PyROOT module. Note, that you could choose other approaches to making plots, such as using matplotlib, but the ROOT files need to be accessed with ROOT or uproot so we’ll stick with ROOT for now.
Once we’ve made the plots, we’ll spend some time examining them and trying to interpret the distributions so that we can develop some intuition for how things look.
If you run into problems with any of these steps, please reach out to the organizers through the dedicated Mattermost channel.