Episode
Set up a workflow
Questions
- How to set up Argo Workflow engine?
- How to submit a test job?
- Where to find the output?
Objectives
- Deploy Argo Workflows services to the cluster.
- Submit a test job.
- Find the output in the storage.
- You will need the Infomaniak account and a public cloud project. See the Setup instructions.
- You will need to have
- the tutorial code in your local working environment
kubectlinstalled to interact with Kubernetes clusteropenstackandswiftinstalled to handle storageargoCLI to submit the jobs installed.- See the Setup instructions.
- You wil need the storage container and cluster created as instructed on the previous pages.
Move to your local working environment and get access to the storage by sourcing the OpenStack RC file that you have downloaded previously. If you use a virtual environment, activate it. Make sure you have set the KUBECONFIG variable to get access to the cluster:
cd <your_path>/infomaniak-cloud-test
source venv/bin/activate # if you created a virtual environment with name venv
source <path_to_rc_file_if_not_local/>PCU-XXXXXX-openrc.txt
export KUBECONFIG=<path_to_config_file_if_not_local/>pck-XXXXXX-kubeconfig
Deploy Argo Workflows service
Create a namespace
kubectl create ns argoSet up Argo workflows controller and server with
kubectl apply -n argo --server-side -f https://github.com/argoproj/argo-workflows/releases/download/v4.0.1/install.yamlDeploy a service account and its roles and bindings with
kubectl apply -f manifests/Check the resources with
kubectl get all -n argoWhen ready, you will see an output similar to this:
NAME                                       READY   STATUS    RESTARTS   AGE
pod/argo-server-7895b75d9b-w7nhl           1/1     Running   0          35s
pod/workflow-controller-57f7bb576d-zd968   1/1     Running   0          35s

NAME                  TYPE        CLUSTER-IP      EXTERNAL-IP   PORT(S)    AGE
service/argo-server   ClusterIP   10.100.218.36   <none>        2746/TCP   35s

NAME                                  READY   UP-TO-DATE   AVAILABLE   AGE
deployment.apps/argo-server           1/1     1            1           36s
deployment.apps/workflow-controller   1/1     1            1           36s

NAME                                             DESIRED   CURRENT   READY   AGE
replicaset.apps/argo-server-7895b75d9b           1         1         1       36s
replicaset.apps/workflow-controller-57f7bb576d 1 1 1 36sAccess to storage
Ensure that you have created the storage container:
$ openstack container list
+-----------+
| Name      |
+-----------+
| mystorage |
+-----------+
Create access credentials
openstack ec2 credentials createYou will need the values of access and secret fields in what follows.
In your terminal, create the cluster “secrets” to access the storage with
kubectl create secret generic s3-credentials \
  --from-literal=S3_ACCESS_KEY_ID='<the value of the access field>' \
  --from-literal=S3_SECRET_ACCESS_KEY='<the value of the secret field>' \
  -n argo
Simple test job
The example code repository has a simple Argo workflow configuration example to test the storage access. It uses the credentials that were just created as cluster secrets.
Submit the test job with
argo submit -n argo read-write-test-s3/simple-test-s3.yamlFollow its progress with
argo get @latest -n argoOnce done (very quickly for this short job), you will see:
Name:                simple-s3-mr9p6
Namespace:           argo
ServiceAccount:      argo-service-account
Status:              Succeeded
Conditions:
 PodRunning          False
 Completed           True
Created:             Tue May 05 20:39:49 +0200 (37 seconds ago)
Started:             Tue May 05 20:39:49 +0200 (37 seconds ago)
Finished:            Tue May 05 20:40:20 +0200 (6 seconds ago)
Duration:            31 seconds
Progress:            1/1
ResourcesDuration:   0s*(1 cpu),6s*(100Mi memory)

STEP                TEMPLATE          PODNAME          DURATION  MESSAGE
 ✔ simple-s3-mr9p6  write-and-upload  simple-s3-mr9p6  26s
If all went as expected, you will find the test output in the storage container:
$ swift download mystorage simple.txt
simple.txt [auth 0.295s, headers 0.364s, total 0.431s, 0.000 MB/s]
$ cat simple.txt
Hello from Argo + Infomaniak S3!!!
What happened?
Have a look in the Argo workflow definition file (read-write-test-s3/simple-test-s3.yaml). The workflow has a single job step which uses an alpine container and writes some text in a file:
    container:
      image: alpine:3.18
      command: [sh, -c]
      args:
        - |
          # Create the file in /tmp
          echo "Hello from Argo + Infomaniak S3!!!" > /tmp/simple.txt
          ls -la /tmp/simple.txt
The file is written to the object storage through the output definition:
    outputs:
      artifacts:
      - name: simple-file
        path: /tmp/simple.txt
        archive:
          none: {}           # no compression
        s3:
          endpoint: s3.pub1.infomaniak.cloud # from https://docs.infomaniak.cloud/object_storage/s3/
          bucket: mystorage  # created with: openstack container create mystorage
          region: us-east-1  # placeholder, Infomaniak storage is in Switzerland
          accessKeySecret:   # created with: openstack ec2 credentials create (take access, secret)
            name: s3-credentials
            key: S3_ACCESS_KEY_ID
          secretKeySecret:
            name: s3-credentials
            key: S3_SECRET_ACCESS_KEY
          insecure: false
          key: simple.txt  # the file name for the storage
It uses an artifact of type S3, and it reads the access credentials from the secret that we just created, and writes the new file to the storage container.
It is a good practice to delete the job resources after the job has finished. You can delete the latest workflow with:
argo delete @latest -n argoCMS open data workflow
Workflow structure
The CMS open data processing workflow example is slightly more complex. It consists of four tasks.
Reading the metadata for the dataset to be processed
- uses the cernopendata-client container image
- reads the file list (each dataset consists of several files)
- gets data type (collision or simulated data)
Preparing the job list
- the processing jobs can run parallel and input data needs to be assigned to them evenly
- it is convenient to have one or more entire files to process in one job
- for a full-scale analysis, all events in the dataset will be processed, but for testing, a smaller amount of events can be defined
Pulling the big CMSSW container image to each cluster node
- this is to avoid multiple simultaneous image pulls for parallel jobs on the same node
Running the processing task
- this is the heavy processing step and writes the output files in the
scatterdirectory of the storage - it writes the logs in the
logsdirectory of the storage
Run the job
Change the default parameters
The default input values are for a 45-node cluster and to process all 353 files of the CMS “MuonEG” Open dataset. Change the input values of the workflow file as follows:
  arguments:
    parameters:
    - name: nEvents
      #FIXME
      # Number of events in the dataset to be processed (-1 is all)
      value: 8000
    - name: recid
      #FIXME
      # Record id of the dataset to be processed
      value: 30511
    - name: nJobs
      #FIXME
      # Number of jobs the processing workflow should be split into
      # Matches number of files(and defines the cluster size, 4 x nodes if 4 vCPU)
      value: 8
    - name: bucket
      #FIXME
      # Name of cloud storage bucket for storing outputs
      value: mystorage
    - name: nNodes
      #FIXME
      # Number of nodes for prepull
      value: 2
This will share the full file list in eight parts, pass them to the processing step which will then process 1000 first events in the respective files.
Submit the job
Submit the job as before:
$ argo submit -n argo cms-pfnano-process/run-pfnano-s3.yaml
Name:                pfnano-process-949g2
Namespace:           argo
ServiceAccount:      argo-service-account
Status:              Pending
Created:             Tue May 05 21:52:05 +0200 (1 second ago)
Progress:
Parameters:
  nEvents:           8000
  recid:             30511
  nJobs:             8
  bucket:            mystorage
  nNodes:            2
Follow the progress
Observe the progress - you will see that the first two steps go fast but the prepull step takes longer:
$ argo get @latest -n argo
Name:                pfnano-process-949g2
Namespace:           argo
ServiceAccount:      argo-service-account
Status:              Running
Conditions:
 PodRunning          False
Created:             Tue May 05 21:52:05 +0200 (5 minutes ago)
Started:             Tue May 05 21:52:05 +0200 (5 minutes ago)
Duration:            5 minutes 25 seconds
Progress:            2/4
ResourcesDuration:   17s*(100Mi memory),0s*(1 cpu)
Parameters:
  nEvents:           8000
  recid:             30511
  nJobs:             8
  bucket:            mystorage
  nNodes:            2

STEP                            TEMPLATE               PODNAME                                                DURATION  MESSAGE
 ● pfnano-process-949g2         cms-od-example
 ├─✔ get-metadata               get-metadata-template  pfnano-process-949g2-get-metadata-template-3541722543  12s
 ├─✔ joblist                    joblist-template       pfnano-process-949g2-joblist-template-2567872736       9s
 ├─◷ prepull-pfnano-image(0:1)  prepull-pfnano-image   pfnano-process-949g2-prepull-pfnano-image-647290456    4m        PodInitializing
 └─◷ prepull-pfnano-image(1:2)  prepull-pfnano-image   pfnano-process-949g2-prepull-pfnano-image-2409759730   4m        PodInitializing
The prepull takes approximately 15 minutes. In some cases, the image pull fails but it restarts automatically. If you are interested to inspect what happens, you can find the pod names with:
$ kubectl get pods -n argo
NAME                                                    READY   STATUS            RESTARTS   AGE
argo-server-7895b75d9b-w7nhl                            1/1     Running           0          114m
pfnano-process-949g2-get-metadata-template-3541722543   0/2     Completed         0          7m49s
pfnano-process-949g2-joblist-template-2567872736        0/2     Completed         0          7m19s
pfnano-process-949g2-prepull-pfnano-image-2409759730    0/2     PodInitializing   0          6m59s
pfnano-process-949g2-prepull-pfnano-image-647290456     0/2     PodInitializing   0          6m59s
workflow-controller-57f7bb576d-zd968                    1/1     Running           0          114m
and you then read the events with kubectl describe pod <pod name> -n argo.
Once the processing starts, you will see the jobs running in parallel.
STEP                                                                TEMPLATE               PODNAME                                                DURATION  MESSAGE
 ● pfnano-process-949g2                                             cms-od-example
 ├─✔ get-metadata                                                   get-metadata-template  pfnano-process-949g2-get-metadata-template-3541722543  12s
 ├─✔ joblist                                                        joblist-template       pfnano-process-949g2-joblist-template-2567872736       9s
 ├─✔ prepull-pfnano-image(0:1)                                      prepull-pfnano-image   pfnano-process-949g2-prepull-pfnano-image-647290456    12m
 ├─✔ prepull-pfnano-image(1:2)                                      prepull-pfnano-image   pfnano-process-949g2-prepull-pfnano-image-2409759730   15m
 ├─● runpfnano(0:eventsinjob:1000,firstfile:1,it:1,lastfile:45)     runpfnano-template     pfnano-process-949g2-runpfnano-template-2847614267     2m
 ├─● runpfnano(1:eventsinjob:1000,firstfile:46,it:2,lastfile:89)    runpfnano-template     pfnano-process-949g2-runpfnano-template-3575107822     2m
 ├─● runpfnano(2:eventsinjob:1000,firstfile:90,it:3,lastfile:133)   runpfnano-template     pfnano-process-949g2-runpfnano-template-3476365621     2m
 ├─● runpfnano(3:eventsinjob:1000,firstfile:134,it:4,lastfile:177)  runpfnano-template     pfnano-process-949g2-runpfnano-template-2488933712     2m
 ├─● runpfnano(4:eventsinjob:1000,firstfile:178,it:5,lastfile:221)  runpfnano-template     pfnano-process-949g2-runpfnano-template-3276409680     2m
 ├─● runpfnano(5:eventsinjob:1000,firstfile:222,it:6,lastfile:265)  runpfnano-template     pfnano-process-949g2-runpfnano-template-2485157448     2m
 ├─● runpfnano(6:eventsinjob:1000,firstfile:266,it:7,lastfile:309)  runpfnano-template     pfnano-process-949g2-runpfnano-template-2352203977     2m
 └─● runpfnano(7:eventsinjob:1000,firstfile:310,it:8,lastfile:353)  runpfnano-template     pfnano-process-949g2-runpfnano-template-1215130620     2m
You can observe the progress of each job from the logs with kubectl logs <pod name> -n argo.
Find the output
Once finished, you can find the output files in the storage container:
 $ swift list --lh mystorage
7.8K 2026-05-05 19:52:17         application/gzip pfnano/30511/files_30511.txt
 11K 2026-05-05 20:11:05 application/octet-stream pfnano/30511/logs/1.logs
 11K 2026-05-05 20:11:13 application/octet-stream pfnano/30511/logs/2.logs
 11K 2026-05-05 20:11:13 application/octet-stream pfnano/30511/logs/3.logs
 11K 2026-05-05 20:11:15 application/octet-stream pfnano/30511/logs/4.logs
 11K 2026-05-05 20:11:19 application/octet-stream pfnano/30511/logs/5.logs
 11K 2026-05-05 20:11:20 application/octet-stream pfnano/30511/logs/6.logs
 11K 2026-05-05 20:11:11 application/octet-stream pfnano/30511/logs/7.logs
 11K 2026-05-05 20:11:20 application/octet-stream pfnano/30511/logs/8.logs
 25M 2026-05-05 20:11:04 application/octet-stream pfnano/30511/scatter/pfnanooutput1.root
 29M 2026-05-05 20:11:12 application/octet-stream pfnano/30511/scatter/pfnanooutput2.root
 28M 2026-05-05 20:11:13 application/octet-stream pfnano/30511/scatter/pfnanooutput3.root
 30M 2026-05-05 20:11:14 application/octet-stream pfnano/30511/scatter/pfnanooutput4.root
 30M 2026-05-05 20:11:19 application/octet-stream pfnano/30511/scatter/pfnanooutput5.root
 31M 2026-05-05 20:11:20 application/octet-stream pfnano/30511/scatter/pfnanooutput6.root
 27M 2026-05-05 20:11:11 application/octet-stream pfnano/30511/scatter/pfnanooutput7.root
 31M 2026-05-05 20:11:20 application/octet-stream pfnano/30511/scatter/pfnanooutput8.root
  35 2026-05-05 18:40:14 text/plain;charset=utf-8 simple.txt
235M
If you wish, you can download the logs and output files locally with
swift download mystorage --prefix pfnano/30511/logs/ --output-dir logs/testjob
swift download mystorage --prefix pfnano/30511/scatter/ --output-dir pfnano/testjob
In this example, only 8000 events were processed. For any real-scale processing, keep in mind that the output files can be big so avoid unnecessary downloads.
Delete the cluster
Once finished, delete the cluster to avoid unnecessary costs. You can do it from the Kubernetes tab of the Cloud Computing dashboard in the Infomaniak Web GUI:
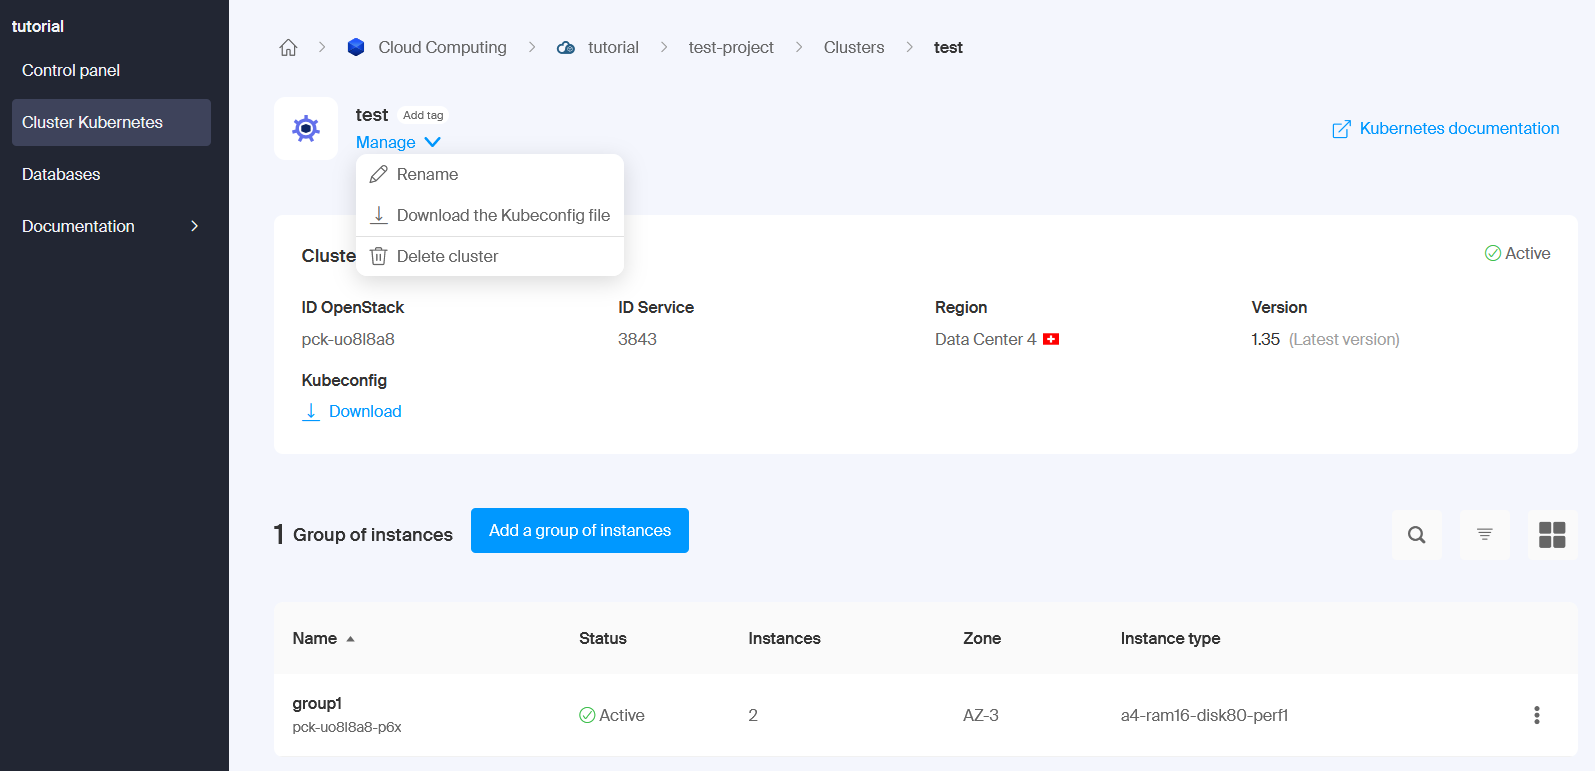
This brings to the cluster page where you find the delete option under Manage:
Both the control plane and node pool will be deleted and you are asked to confirm the choice.
Costs
The cost of these quick exercises is less than 0.5 €, depending on the uptime of the cluster (approximately 0.1 €/hour for a small 2-node cluster).
Key Points
- Once the cluster is up, you will first deploy the Argo Workflows services using kubectl.
- You will submit and monitor the workflow with argo.